On this page
- Who this is for
- Separate prediction from activation
- Plan adoption, renewal and expansion reviews
- Build the measurement in eight steps
- Keep delivery, outcomes and economics separate
- Choose tools for the measurement task
- Compare measurement approaches
- Budget the measurement work
- Match the review to the client and stage
- Review five evidence gates
- Review attribution and operational limits
- Use a recurring scorecard
- Frequently asked questions
- Keep the claim within the evidence
- A fictional financial scenario
- Start with a scoped MarketPulse evaluation
To evaluate buyer-intent ROI, define the population, action, comparison, outcome window and full cost before launch. Distinguish an observed opportunity, influenced pipeline and an estimated incremental result. Accounts showing research activity may have purchased without the program, so overlap alone cannot prove value created.
The framework below is a proposed measurement plan for an intent-informed workflow. Keep raw counts and uncertainty visible, and report a descriptive or process result when the available evidence cannot support a causal ROI claim.
Who this is for
- Agency owners and client-success leads responsible for adoption, QBRs, renewal, and expansion.
- Demand generation, RevOps, and sales leaders who need a shared measurement contract.
- Analysts joining intent signals, activation, opportunities, costs, and revenue at account level.
- Service businesses reviewing client-facing research, activation and reporting requirements.
For agency teams, proving ROI from an agency intent data service requires more than a dashboard. This guide provides a complete implementation framework: workflow, reporting tools, approach comparison, cost model, KPIs, client segmentation, signal and identity evidence, risk controls, QBR template, and practical examples.
Separate prediction from activation
An intent program makes two different claims:
- Prediction claim: accounts with defined signals are more likely to progress than comparable accounts without them.
- Activation claim: acting on those signals causes better outcomes than business as usual for similarly eligible accounts.
The first claim validates prioritization. The second supports an ROI case for the service. Do not blend them.
A strong agency intent-data service ROI strategy follows this chain:
eligible account → qualified signal → identity confidence → permitted play → completed action → account outcome → incremental economics
Every arrow must be observable. If the agency cannot show which account received which signal, which play occurred, and what happened next, the report is activity attribution rather than proof.
The measurement contract
Before activation, the agency and client should agree in writing on:
- ICP, eligible account universe, segments, and exclusions;
- signal source, topic, threshold, recency, and time-to-live;
- account-, buying-group-, or person-level identity requirements;
- treatment play and business-as-usual control condition;
- sales SLA and client responsibilities;
- primary outcome and secondary leading indicators;
- attribution and observation window;
- opportunity stage and amount definitions;
- gross-margin assumption and full cost ledger;
- sample-size and maturity limitations;
- rules for duplicates, existing pipeline, reassignment, and missing data;
- decision thresholds for continue, revise, expand, or stop.
This contract protects renewal conversations from retrospective rule changes. It also makes an inconclusive result useful: the team can see whether the problem was coverage, action, sample size, data completeness, or the underlying offer.
Plan adoption, renewal and expansion reviews
Proof is not only a finance exercise. It changes how the client uses the service. Adoption rises when sellers can see why an account qualified, what action is expected, and how their response becomes part of the evidence. A weekly exception review should show rejected alerts, late actions, identity problems, and missing context. Fixing those issues is often more valuable in the first month than presenting a speculative revenue multiple.
Plan reviews in stages: definitions and access first, then coverage and workflow completion, then mature opportunities and purchases. State the expected outcome window and keep a stop or revision decision available rather than using delay as an indefinite explanation.
Expansion should require a written gate. For example, expand from three topics to six only if usable coverage clears the agreed threshold, at least a defined share of qualified signals receives the play inside the SLA, data completeness is acceptable, and the expected marginal gross profit exceeds the added wholesale and service cost. If those conditions fail, the correct decision may be to narrow topics, change activation, improve CRM discipline, or stop.
Client-success teams should also record the decision generated by each report. Did the client change account priority, approve a campaign, map a buying group, rescue an opportunity, or decline the recommendation? Decision adoption is a leading indicator that sits between dashboard usage and revenue. It gives the agency a concrete improvement target without pretending that every decision caused a sale.
Build the measurement in eight steps
1. Freeze the account universe and primary outcome
Create one eligible-account table with stable account IDs. Include segment, size, region, sales owner, prior engagement, open-opportunity status, and historical outcome fields. Choose one primary outcome, such as qualified opportunity creation or closed-won gross profit. Meetings and pipeline may be leading indicators, but they should not silently become realized ROI.
2. Define the signal precisely
Record source, topic, score or threshold, timestamp, lookback, freshness, and granularity. Separate first-party website visits, forms, product behavior, and email engagement from third-party topic research. Preserve lineage instead of reducing every source to a mysterious “hot” label.
3. Validate identity and eligibility
Resolve the signal to the correct account, buying group, or person at an agreed confidence. Apply ICP, territory, customer, open-opportunity, suppression, and permission rules. Quarantine uncertain matches and track the reason. A large raw feed with weak account matching will inflate activity while depressing useful coverage.
4. Create a credible counterfactual
Where practical, randomize eligible high-intent accounts into:
- Treatment: the intent-triggered play is available and executed.
- Holdout: the score is hidden and business as usual continues.
Stratify by account tier, industry, territory, prior engagement, and open-opportunity status when those factors materially affect conversion. Keep the play and response SLA stable. The IAB’s guidance on incremental measurement emphasizes a credible counterfactual, bias control, and transparent uncertainty.
If randomization is impractical, match control accounts on the strongest known drivers, use a staggered rollout, or compare pre/post changes with a comparable untreated group. Label observational evidence as directional and explain selection bias.
5. Instrument the signal-to-outcome ledger
For each account, log:
- signal ID, source, topic, time, and confidence;
- qualification result and rejection reason;
- treatment or holdout assignment;
- first action, channel, owner, and time to action;
- reply, meeting, opportunity, stage, amount, and close;
- media, data, enrichment, agency, and client labor cost;
- opt-out, complaint, suppression, or data correction.
Join on the stable account ID, not a mutable company name. Keep the original event timestamps so the analysis can enforce sequence and attribution windows.
6. Run the play with approval boundaries
A play may create a research task, update an ad audience, draft outreach, recommend content, alert an account owner, or identify a customer-risk hypothesis. Automation can prepare or execute low-risk steps, but consequential outreach, sensitive person-level use, or large spend changes should follow defined human approval.
7. Calculate lift and economics
For a rate outcome:
absolute lift = treatment rate − holdout raterelative lift = absolute lift ÷ holdout rateincremental outcomes = absolute lift × treated accounts
For financial impact:
incremental gross profit = incremental won revenue × client gross marginfully loaded program cost = data + agency fee + media + creative + operations + incremental sales laborROI = (incremental gross profit − fully loaded program cost) ÷ fully loaded program costpayback period = program cost ÷ monthly incremental gross profit
Always show treatment and holdout counts, sample size, observation maturity, and a confidence or uncertainty range when the method supports it. Relative lift can appear dramatic when the baseline is small; absolute differences and raw counts prevent that distortion.
8. Review monthly, mature quarterly, and decide
The monthly view should emphasize delivery, adoption, data completeness, costs, and leading funnel movement. The quarterly or sales-cycle-matured view should update opportunities, wins, gross profit, and ROI. Use fixed rules for expansion: sufficient usable coverage, on-time activation, acceptable client adoption, improving economics, and no material trust or compliance issues.
Keep delivery, outcomes and economics separate
Use the following proposed measurement ladder to keep delivery metrics separate from customer outcomes and economics.
Layer 1: delivery and signal quality
- eligible-account coverage;
- match rate and confidence distribution;
- valid contact rate where person-level activation is permitted;
- signal freshness and delivery latency;
- duplicate and false-positive rejection rate;
- topic and segment coverage;
- cost per usable signal or eligible account.
These metrics diagnose the input. They are not ROI.
Layer 2: adoption and execution
- percent of qualified signals accepted;
- percent acted on inside the SLA;
- median time to first action;
- workflow completion rate;
- seller or client user adoption;
- rejection reasons;
- suppression and approval compliance.
Low adoption means the program cannot fairly be judged only on revenue. It may also mean the play is not trusted or operationally useful.
Layer 3: funnel movement
- engagement or positive response per eligible account;
- meetings per 100 eligible accounts;
- qualified-opportunity creation rate;
- pipeline per account;
- stage progression;
- win rate and average deal size;
- median days to opportunity and close.
Show these metrics for treatment and control. “Pipeline influenced” should remain a descriptive view with an explicit touch and lookback rule.
Layer 4: economics and retention
- incremental won revenue and gross profit;
- cost per incremental opportunity or win;
- ROI and payback range;
- agency gross margin by client;
- renewal and expansion;
- support hours and cost-to-serve;
- revenue retention.
A program can improve the client’s pipeline while remaining unprofitable for the agency. Both sides need their own economics view.
Choose tools for the measurement task
The best tools for proving ROI from an agency intent-data service are the systems that preserve definitions and join the evidence. A long vendor list is less useful than a complete measurement architecture.
1. CRM as the revenue ledger
Use a CRM or appropriate system of record for stable account keys, opportunity stages, amounts, owners and outcomes. Review missing fields and associations. A software logo does not establish complete history or valid attribution.
Best for: outcome ownership and client adoption. Limitation: CRM data reflects rep behavior and may be incomplete or delayed.
2. Warehouse or governed data layer
A warehouse, customer data platform, or controlled analytics database can join signal, identity, campaign, CRM, product, and cost records. It preserves event-level lineage and supports cohort analysis beyond a marketing dashboard.
Best for: stable joins, historical events, and reproducible analysis. Limitation: requires data engineering, access controls, and clear source ownership.
3. BI and client reporting
A BI tool or white-label reporting layer presents delivery, treatment/control, funnel, economics, and limitations. The dashboard should let the agency drill from summary metrics to account-level evidence without exposing data across clients.
Best for: recurring scorecards and QBRs. Limitation: a polished dashboard cannot repair a weak experimental design.
4. Experimentation and lift tools
Advertising platforms may offer conversion-lift studies for eligible campaigns, while a data team can randomize or match accounts independently. Platform tools can be useful for channel-specific measurement; an independent account-level design is often better for a multi-channel agency service.
Best for: causal evidence when sample size and eligibility are sufficient. Limitation: privacy thresholds, conversion lag, platform boundaries, and statistical power can make results inconclusive.
5. Cost and service-delivery ledger
Finance, project management, time tracking, media records, and vendor usage must feed the cost model. Without them, the numerator may be debated while the denominator is simply wrong.
Best for: fully loaded ROI and agency margin. Limitation: staff time and shared overhead need consistent allocation rules.
Compare measurement approaches
- Reactive: ROI discussion begins when the client questions value. Benefit: Low setup. Limitation: Definitions change after results; renewal becomes defensive. Use: Recovery when no plan exists.
- Proactive attribution: Definitions and dashboards are set before launch. Benefit: Clearer journey and adoption evidence. Limitation: Influenced outcomes still do not prove causality. Use: Most accounts as a minimum standard.
- Data-led incrementality: Eligible accounts are assigned to treatment and holdout or a credible control. Benefit: Strongest evidence of activation lift. Limitation: Needs volume, discipline, time, and analytical skill. Use: Material programs and skeptical stakeholders.
- Hybrid maturity path: Attribution launches immediately; causal test runs when feasible. Benefit: Balances speed and rigor. Limitation: Requires strict labels so directional and causal views are not blended. Use: Typical agency-client program.
The recommended path is hybrid: use a pre-agreed attribution ledger from day one, then add randomized or matched control evidence when the account volume and sales cycle permit. Never wait until a QBR to decide what ROI means.
Budget the measurement work
Measurement should be part of the service scope, not free aftercare. Investment includes discovery, CRM cleanup, stable identifiers, integration, reporting, analyst time, client meetings, test design, data retention, and cost reconciliation.
A practical budget uses three components:
- One-time measurement setup: definitions, baseline, fields, integrations, dashboard, and pilot design.
- Recurring reporting and analysis: monthly data QA, scorecard, exceptions, opportunity maturity, and client discussion.
- Periodic deeper study: cohort analysis, holdout readout, attribution reconciliation, and expansion decision.
Do not prescribe a universal dollar amount. Tie measurement effort to contract value, sales-cycle length, account volume, stakeholder skepticism, and downside risk. A small client may need a disciplined scorecard and matched baseline. A large multi-channel program may justify an analyst, warehouse work, and a formal experimental design.
Expansion economics
Expansion should be funded by evidence, not excitement. Model:
- expected additional eligible accounts;
- marginal wholesale usage;
- new activation labor and media;
- client sales capacity;
- expected incremental gross profit range;
- agency gross margin after added support;
- time to mature the expanded cohort.
If coverage is strong but adoption is weak, fix the workflow before adding topics. If adoption is strong but outcomes are unchanged, revisit the signal, audience, offer, or channel. If outcomes improve but margins fall, reprice or standardize delivery.
Match the review to the client and stage
New pilot clients
Focus on usable coverage, match quality, workflow adoption, time to action, and early opportunity creation. Define the full-cycle outcome but admit that closed revenue may not mature during the pilot.
Established clients with stable CRM data
Use randomized holdouts or matched cohorts, full cost, pipeline aging, win rate, gross profit, and sales-cycle change. These clients can support a stronger renewal and expansion case.
Small-account or low-volume clients
Use longer observation windows, pooled cohorts across comparable periods, or staggered rollout. Avoid exaggerated percentages based on a handful of accounts. Qualitative evidence may explain workflow value, but it should not be called causal ROI.
Clients with open opportunities
Separate net-new, expansion, acceleration, and retention use cases. Do not credit the program with sourcing an opportunity that already existed. Measure stage progression or velocity against a suitable baseline.
At-risk clients
Run a data and expectation audit before promising a better dashboard. Check whether the service delivered usable signals, the client acted, sales recorded outcomes, and enough time elapsed. A reactive rescue cannot create missing counterfactual evidence.
Highly regulated or sensitive markets
Use stricter source, identity, permission, retention, and approval gates. Proof may require privacy-safe aggregation and more limited person-level activation. Legal review is jurisdiction and use-case specific.
Review five evidence gates
The strongest signal quality and measurement framework uses five evidence gates.
Gate 1: source evidence
Can the agency name the source type, topic or behavior, timestamp, lookback, and limitations? First-party and third-party intent should remain distinguishable.
Gate 2: identity evidence
Is the action justified at the account, buying-group, or person level? Record match confidence and validation. Never imply that every website visitor or researcher can be identified.
Gate 3: fit evidence
Does the account meet the client-approved ICP, geography, size, exclusions, and customer or opportunity rules? Intent without fit creates expensive noise.
Gate 4: activation evidence
Was a specific, permitted play executed within the signal’s useful life? Record owner, timestamp, content or action type, approval, and completion. An alert left unread cannot create lift.
Gate 5: outcome evidence
Did the account progress, and was the difference stronger than a credible counterfactual? Join outcome and cost at account level. State when volume, maturity, concurrent campaigns, or missing CRM data weaken the inference.
Three implementation examples
- Seller-priority play: eligible high-intent accounts are randomized. Treatment reps receive research tasks with approved context; holdout reps follow normal prioritization. Compare completed tasks, meetings, opportunities, wins, and time to opportunity.
- Account advertising play: treatment accounts enter a topic-matched audience; control accounts remain on business as usual. Compare qualified opportunity and gross-profit lift after media and service costs, not clicks alone.
- Customer expansion play: current customers showing relevant research are split into a guided expansion review and the standard success cadence. Existing open expansions are excluded, and outcomes are reported separately from new-logo acquisition.
Review attribution and operational limits
Attribution risk
Concurrent ads, outbound, events, rep activity, seasonality, and existing demand can all produce the outcome. Influenced pipeline is useful for describing journeys but cannot establish incrementality on its own.
Statistical risk
Small samples, low baseline rates, uneven territories, and long sales cycles create unstable estimates. Report raw counts, absolute lift, uncertainty, and maturity. “Inconclusive” is a valid finding.
Operational risk
Rep noncompliance, late action, inconsistent messaging, missing CRM fields, and treatment leakage weaken the test. Monitor execution before blaming the signal.
Expectation risk
A short topic-research evaluation can test data usefulness and review effort. It cannot establish closed-won ROI for a sales cycle whose outcomes have not matured. Do not imply a fixed native report-pilot package.
Data-use and privacy risk
Use only permitted sources and actions, honor suppression and rights, and separate clients. BrandWell’s privacy policy and terms describe provider-side commitments and customer responsibilities; they do not replace the agency’s own notices, agreements, and legal review.
Client-trust risk
Keep outreach context within what the evidence and approved use support. Give the client a data dictionary, stated limitations, correction process and accountable owner.
Use a recurring scorecard
A strong agency intent-data service template treats reporting as a monthly operating loop and a quarterly decision.
Monthly scorecard
- program definition and any approved changes;
- eligible accounts, coverage, identity confidence, and freshness;
- qualified, accepted, activated, rejected, and suppressed counts;
- time to action and workflow completion;
- treatment and control leading outcomes;
- cost ledger and delivery margin;
- data gaps, incidents, and corrective actions;
- next-month tests and approvals.
Quarterly or matured-cohort QBR
- decision summary: continue, revise, expand, or stop;
- cohort maturity and sample limitations;
- prediction evidence by signal band;
- activation lift with raw counts and uncertainty;
- opportunities, wins, gross profit, ROI, and payback range;
- sourced, influenced, and incremental views kept separate;
- agency gross margin and service load;
- account-level evidence appendix;
- client stories or examples only when verified and permissioned;
- expansion scenario and the evidence required to approve it.
Frequently asked questions
How do you prove the ROI of an agency intent-data service?
Predefine the eligible accounts, signal, play, outcome, window, and cost. Compare treated high-intent accounts with a randomized or credible control, then calculate incremental gross profit after every program cost.
Should agencies report signal volume or business outcomes?
Report signal volume as delivery evidence, then adoption, funnel, and economics. Signal volume alone does not show client value.
What is the difference between influenced pipeline and incremental pipeline?
Influenced pipeline follows a touch and lookback rule. Incremental pipeline estimates what happened because of the program relative to a credible counterfactual. They answer different questions.
What if the client has too few accounts for a holdout?
Use a matched cohort, staggered rollout, longer observation window, or pooled comparable periods. Label the result directional, show raw counts, and avoid causal language.
Which ROI metrics belong in a QBR?
Coverage, acceptance, time to action, meetings and opportunities per eligible account, pipeline, wins, gross profit, full cost, lift, ROI range, payback, maturity, and limitations.
How much should measurement cost?
Price the setup, ongoing data QA and reporting, and periodic deeper analysis separately. The appropriate investment depends on contract value, volume, sales cycle, data readiness, and rigor required.
Can a seven-day pilot prove ROI?
Usually not full-cycle revenue ROI. It can test report demand, topic coverage, identity usability, client interest, and workflow readiness. Set a later window for opportunity and revenue outcomes.
How do agent-ready workflows support ROI proof?
A defined workflow can make the action and evidence easier to review. AIMEE still needs configured tools, permitted inputs, action scope, review owners and outcome capture. Automation does not establish causal impact.
What are the biggest ROI reporting mistakes?
Counting every signaled opportunity as caused by intent, changing definitions after launch, ignoring client sales labor, using percentages without counts, and presenting immature pipeline as revenue.
When should an agency expand the service?
Expand after usable coverage, adoption, outcome evidence, client capacity, and agency margin meet the pre-agreed threshold. Fix weak steps before buying more signals.
Keep the claim within the evidence
A credible report does not ask whether signaled accounts bought. It asks what changed because the agency identified, activated, and measured those accounts – and what that change was worth after every cost.
A fictional financial scenario
Suppose a valid evaluation estimates $10,000 of additional won revenue for the reviewed period. Assume a 60% gross margin and $4,000 of fully counted incremental program costs. Estimated incremental gross profit is $6,000; the scenario’s net benefit is $2,000, and its return on program cost is 50%.
This is hypothetical arithmetic, not a BrandWell result. If estimated additional revenue were only $5,000 under the same margin and costs, gross profit would be $3,000 and return would be negative 25%. The revenue estimate, margin and costs need their own evidence; do not replace incremental revenue with total touched pipeline.
Count a cost once: if the chosen gross-margin calculation already includes a cost, do not subtract that same cost again from program profit. Agree the accounting treatment with the financial owner. Use cash-flow timing and continuing costs for any payback estimate.
Start with a scoped MarketPulse evaluation
MarketPulse supports topic research, with standard plans starting at $500/mo. Growth includes three topics with daily pulls; Scale includes ten topics with daily pulls. Available fields and audience counts vary, and audiences can overlap.
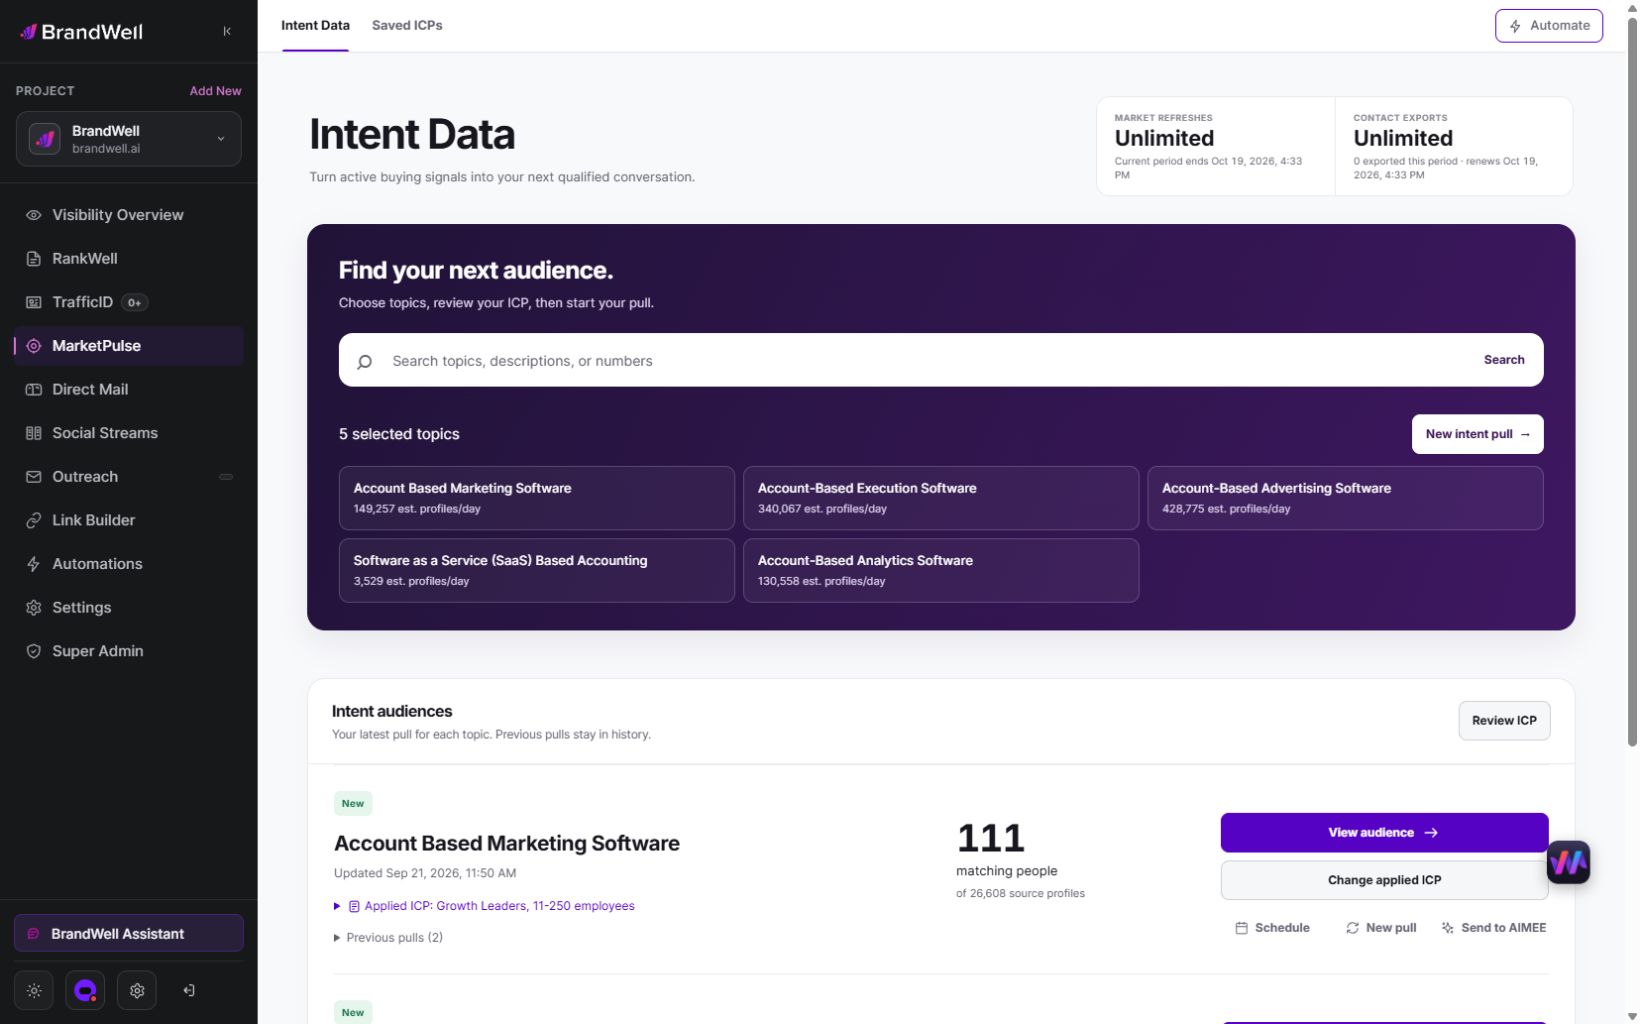
Choose a relevant topic and review the audience using your ICP. Record usefulness, available fields and review effort before proposing activation. Verify the specific client-delivery, integration and permitted-use requirements rather than assuming a native white-label reporting or ad-optimization system.
AIMEE can help prepare research and connected tasks through configured tools and access. Assign owners for consequential actions and record actual outcomes separately from the research signal.
Review MarketPulse’s demo and current plans or the BrandWell product directory.
Reviewed and updated October 3, 2026.

Written by