On this page
- Begin with the investment decision
- Keep four values visible
- A worked ROI example
- Build a measurement workflow
- Choose the strongest practical evidence design
- Count the full program cost
- Include current MarketPulse scope in the cost model
- Use a controlled worksheet
- Leading metrics while revenue matures
- Agencies need two economic views
- When the answer is not yet decision-ready
- Frequently asked questions
Calculate intent data ROI from incremental economic value and the full cost of the evaluated program. Do not credit every opportunity that touched an intent workflow as revenue caused by the data.
ROI = (incremental contribution value minus full program cost) divided by full program cost. Multiply by 100 to express the result as a percentage. Define the contribution measure with finance so fulfillment costs, margins, and program expenses are not omitted or counted twice.
If you cannot estimate what would have happened without the program, report observed outcomes, attribution, and operating evidence. Those can guide a decision, but they do not establish a causal ROI result.
Begin with the investment decision
Decide whether the analysis supports a pilot, renewal, expansion, redesign, or stopping the program. Define the eligible market, unit of analysis, treatment, observation window, costs, and minimum decision evidence before collecting results.
An account-based workflow should preserve account denominators. Several contacts at one company do not become several independent accounts or buyers. An agency also needs to distinguish client outcomes from its own service economics.
Keep four values visible
- Observed outcome: what happened in the evaluated population.
- Counterfactual: a credible estimate of what would have happened without the added workflow.
- Incremental difference: observed outcome minus that estimate, with uncertainty.
- Economic conversion: the difference translated into an appropriate contribution value and compared with full costs.
Influenced pipeline is not won revenue. Won revenue is not contribution. Contribution attributed to a touch is not automatically incremental contribution. Keep each measure labeled and reconciled.
A worked ROI example
The following numbers are fictional arithmetic, not a BrandWell result or forecast. Suppose two comparable groups each contain 1,000 eligible accounts. The intent-enabled group produces 30 wins; the comparison group produces 20. Revenue per win is $10,000 and finance approves a 60% contribution rate before the separately tracked program costs.
- Observed treatment revenue: 30 times $10,000 = $300,000.
- Comparison revenue: 20 times $10,000 = $200,000.
- Estimated incremental revenue: $100,000, if the design supports the comparison.
- Estimated incremental contribution: $100,000 times 60% = $60,000.
- Full program cost: $40,000.
- ROI: ($60,000 minus $40,000) divided by $40,000 = 50%.
Using all $300,000 treatment revenue would overstate the estimated program contribution. The calculation also depends on a valid comparison, comparable revenue, appropriate margins, adequate observation, and complete costs. The arithmetic alone does not validate those assumptions.
If uncertainty suggests five to fifteen incremental wins rather than precisely ten, the same assumptions produce $30,000 to $90,000 incremental contribution and ROI from minus 25% to 125%. That is a sensitivity range, not a statistical confidence interval.
Build a measurement workflow
- Freeze eligibility. Define accounts, topics, roles, regions, exclusions, and entry time. Preserve units with no action.
- Write definitions. Name delivered signal, usable record, accepted action, meeting held, qualified opportunity, win, revenue, contribution, and cost.
- Choose a comparison. Specify assignment, baseline, holdout, or matched cohort and its limitations.
- Log assignment and action. Record source, topic, observed time, identity, eligibility, owner, assignment, actual action, and outcome separately.
- Open the cost ledger. Capture the same scope and period as the evaluated outcome.
- Protect the comparison. Record crossover, additional campaigns, unlogged manual work, and changed definitions.
- Observe maturity. Allow the sales cycle and reporting delay to develop; label early evidence appropriately.
- Review planned segments. Use meaningful prespecified markets or tiers rather than searching for a favorable slice.
- Make the decision. Expand, continue, redesign, or stop against the original thresholds.
RevOps can own definitions and lineage, finance the contribution and cost assumptions, sales or marketing the actions, and analytics the comparison. Name appropriate security and privacy reviewers for the actual data flow. An agency should not change the client’s definition of success after seeing results.
Choose the strongest practical evidence design
Descriptive reporting
Reconcile signals, actions, outcomes, and costs. This supports operations and identifies gaps, but does not remove selection effects or establish causality.
Attribution
A declared rule allocates value to touches. It can be useful and repeatable, but changing the model can change the allocation without changing customers or revenue. Do not rename it incremental lift.
Matched or before-and-after comparison
Compare similar eligible accounts or periods and document remaining differences. Selection, seasonality, offer changes, sales capacity, and missing outcomes can affect the conclusion.
Randomized comparison
NIST’s experimental-design handbook describes random assignment of factor levels to experimental units. For a marketing test, define the unit and treatment carefully and have the design reviewed before interpreting the outcome.
Random assignment alone does not repair inadequate volume, contamination, missing outcomes, or poor execution. Keep the eligible denominator and assignment record intact, even when some assigned accounts receive no action.
Count the full program cost
Include data and software, implementation, integrations, identity review, research, copy, media, approved channel usage, sales time, agency fees, monitoring, reporting, training, management, governance, rework, and exit. Consider displaced team capacity when it affects the investment decision.
Allocate shared expenses by a documented rule and show plausible alternatives. Do not hide shared costs from a favored program or place the entire bill on one weak use case. Avoid double-counting costs already included in finance’s contribution measure.
Include current MarketPulse scope in the cost model
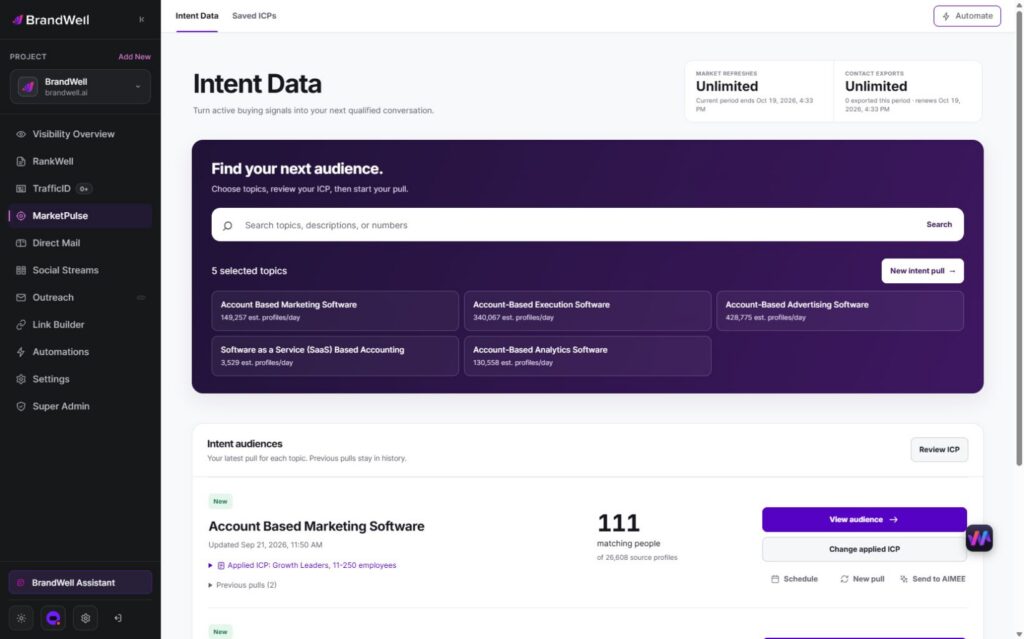
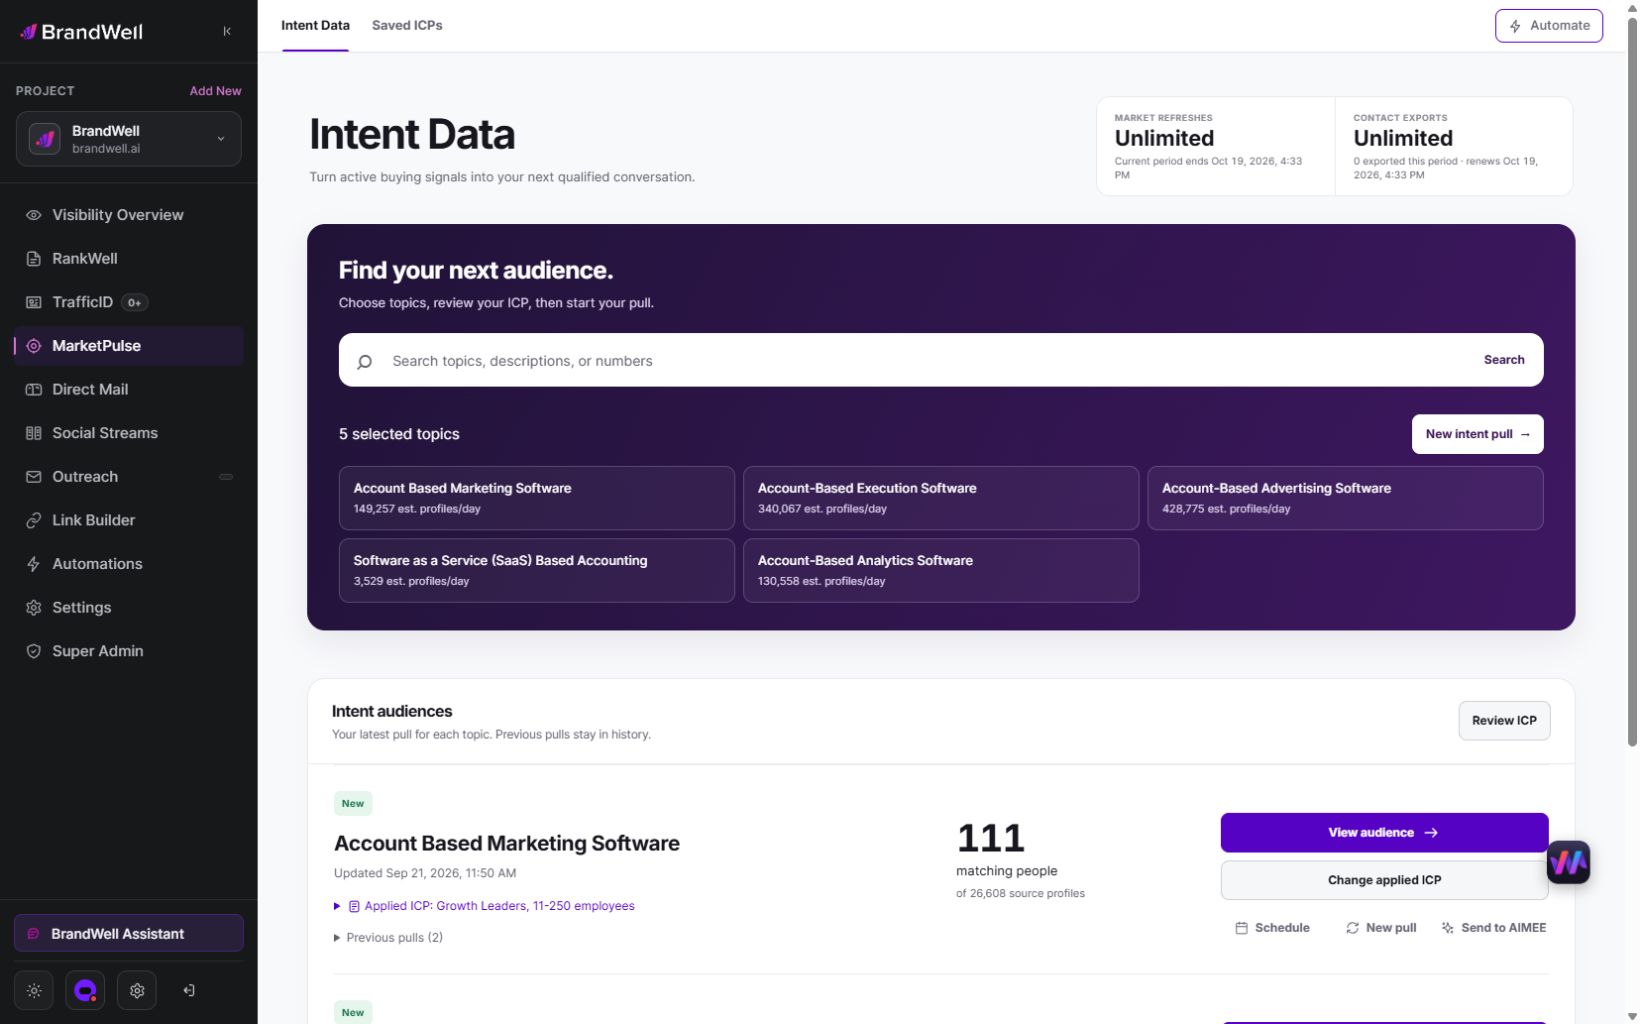
MarketPulse is starting at $500/mo for topic-based intent research, saved ICP filtering, and review of available people and company details.
- Starter:one weekly topic, and 25,000 monthly contact exports.
- Growth:three daily topics, and 100,000 monthly exports.
- Scale:ten daily topics, and unlimited exports.
A pull retrieves available data from the previous 24 hours for a topic. Daily use across included topics gives 90 Growth pulls or 300 Scale pulls in a 30-day month. Weekly Starter pulls vary by calendar month. Counts and fields vary, and audiences can overlap. Eligible early-access discounts are separate from standard pricing.
Growth and Scale include AIMEE for the initial user. It can help prepare assigned work through configured tools and permissions. Connected products, channel usage, and fulfillment may cost extra. Do not assume universal desktop execution, native destinations, API access, white-label delivery, or license resale when budgeting.
Use a controlled worksheet
Separate inputs, eligibility, assignment, actual action, outcomes, costs, assumptions, and decisions. Give each assumption a source, owner, timeframe, and sensitivity range.
- Eligibility: all units that could enter, including no-action and rejected cases.
- Assignment: intended treatment and any crossover.
- Exposure: what action actually occurred, when, and through which channel.
- Outcomes: maturity, missingness, revenue, and qualified progression.
- Costs: complete expenses for the same scope.
- Uncertainty: sample limits, alternative assumptions, and unverified values.
- Decision: the original rule and the evidence supporting the recommendation.
A precise spreadsheet does not create precise evidence. Do not populate outcome cells with a generic vendor benchmark or a projected win rate and then describe the result as observed ROI.
Leading metrics while revenue matures
Track delivered and usable records, identity errors, acceptance, timely approved actions, useful replies, held meetings, qualified opportunities, adoption, exceptions, and full cost per accepted action. Preserve source, observation time, identity uncertainty, and suppression.
A topic signal does not prove purchase readiness or permission for every channel. An enriched phone number is not an opted-in reminder number. Record approved action separately from the signal that informed it.
Agencies need two economic views
The client needs evidence of useful outcomes and the costs of the program. The agency needs its own service revenue, direct delivery work, contribution, support load, retention, and capacity.
A profitable agency package can still deliver poor client value, and a valuable client program can still be unprofitable for an over-scoped agency. Keep both views visible. Available pulls and exports may support agreed client work, but confirm source rights, access, fees, and delivery scope separately.
When the answer is not yet decision-ready
Do not publish a definitive ROI when the sample is tiny, the cycle is longer than observation, most outcomes are missing, cohorts differ materially, crossover is untracked, or one optimistic assumption determines the sign.
Use operational evidence to decide whether to continue a bounded test. Correct the offer, fit, ownership, measurement, or workflow when those are the constraint. Buying more records is not always the next useful step.
Frequently asked questions
Can we use influenced pipeline as ROI?
No. Report it as attribution or descriptive evidence. ROI needs an appropriate economic value, full costs, and a credible incremental comparison.
Is revenue per contact enough?
No. Preserve the relevant unit, overlapping accounts, actual customers, costs, contribution assumptions, and the evidence needed to estimate incremental value.
What should the renewal report recommend?
Expand a passing use case, continue while outcomes mature, redesign a failing component, or stop. Explain the evidence and uncertainty behind the decision.
Watch the MarketPulse demo and review plans starting at $500/mo. Test a defined topic and ICP, record reviewed actions and full costs, and keep observed outcomes separate from causal claims.
Reviewed and updated October 3, 2026.

Written by