On this page
- Define the client decision, baseline, and counterfactual
- Build the data, definitions, windows, owners, and QA workflow
- Seven ROI methods, analytics tools, calculators, and templates
- Experimental, causal, attribution, and observational methods compared
- Budget data, tools, analyst time, and opportunity cost
- Report metrics, segments, uncertainty, and decision thresholds
- When ROI analysis is useful – and when the evidence is too weak
- Use intent, identity, and activation as inputs, not proof
- Control attribution bias, selection, contamination, privacy, and overclaiming
- Use ROI reporting for optimization and renewal without overstating causality
- Calculate the return and its evidence level
- Choose a defensible comparison
- Review MarketPulse in the workflow
- Frequently asked questions
Short answer: Agencies evaluate buyer intent service ROI by agreeing on the client decision, baseline, comparison group, cost definition, outcome, and evidence standard before the service changes behavior. Report delivery, adoption, associated outcomes, attributed outcomes, and incremental impact as different layers. A signaled account that later enters pipeline is useful evidence, but it is not automatically proof that the service caused the pipeline.
Who is this for? CEOs, CFOs, CROs, marketing and RevOps leaders, and agency owners who need a credible way to optimize or renew a recurring buyer-intent service without relying on touched-pipeline theater.
The minimum viable ROI system is a frozen cohort, a credible counterfactual, full cost, consistent outcome definitions, and an audit trail from signal to action to result. Intent and resolved identity remain probabilistic inputs, not proof of purchase or causal impact. The best method is the strongest feasible design for the decision – not the most impressive number available after the campaign.
Current MarketPulse offer: intent-data plans start at $500/mo. See the product, demo, and current plans. Updated October 3, 2026.
Define the client decision, baseline, and counterfactual
Start with the decision the report must support: continue, stop, expand, reduce, change topic mix, change activation, or run a stronger test. Then state the causal question in operational language: “For qualified accounts that could have received this service, what changed because the service existed?”
Write a measurement charter before activation:
- Unit: account, contact, opportunity, territory, campaign, or time period.
- Eligibility: the ICP, exclusions, customer/opportunity state, and data rights that define the population.
- Treatment: what the agency actually delivers, not merely the existence of a signal.
- Primary outcome: one decision-relevant event such as sales-accepted opportunity, qualified pipeline, or gross contribution.
- Guardrails: complaints, opt-outs, policy failures, poor-fit meetings, sales workload, and media waste.
- Window: assignment, activation, exposure, response, and outcome periods appropriate to the buying cycle.
- Counterfactual: holdout, randomized control, matched comparison, interrupted time series, or a clearly limited historical baseline.
- Decision threshold: the minimum effect, evidence quality, and confidence needed to change scope or spend.
A baseline is starting performance under consistent definitions; a counterfactual estimates outcomes without the intervention. Higher conversion among signaled accounts can reflect selection of accounts already more likely to convert. It may inform prioritization, but does not establish incremental service impact.
Build the data, definitions, windows, owners, and QA workflow
This service ROI implementation guide uses a repeatable workflow:
- Freeze eligibility and assignment. Create stable cohort IDs before outcomes are known; document exclusions and contamination rules.
- Define the service receipt. Distinguish signal delivered, accepted, brief created, campaign eligible, account exposed, sales action completed, and contact reached.
- Normalize costs. Capture wholesale data, agency labor, setup, integrations, media, client labor, sales time, creative, analytics, governance, and opportunity cost.
- Instrument the chain. Store source, account resolution, confidence, freshness, activation, owner, timestamps, outcome, and reason-coded rejection.
- Lock windows and metrics. Decide attribution and maturity windows, primary and secondary outcomes, lag handling, and late-arriving data before analysis.
- Run QA. Check duplicates, missing identifiers, stale records, pre-existing pipeline, stage reversals, currency, amount definition, contamination, and deletion.
- Analyze by the chosen method. Preserve all eligible units, including non-delivered, rejected, unexposed, and lost records.
- Report uncertainty and limitations. Show counts, denominators, intervals where applicable, sensitivity, missingness, and alternative explanations.
- Make and log the decision. Continue, stop, resize, retarget, or test again; never let the reporting model change silently.
Useful service ROI templates include a measurement charter, metric dictionary, cohort-assignment file, service-receipt ledger, full-cost worksheet, QA checklist, analysis plan, client scorecard, limitations block, and renewal decision log. An operational checklist should name the agency analyst, client RevOps owner, sales owner, finance approver, privacy/security reviewer, and executive decision maker.
An implementation example might compare eligible target accounts randomly assigned to standard service versus standard service plus validated intent prioritization. If randomization is impossible, freeze a fit-matched cohort using only pre-treatment variables and label the result observational. Do not select controls after seeing which accounts converted.
Seven ROI methods, analytics tools, calculators, and templates
These methods answer different questions. Delivery, adoption and cost reports complement impact evaluation; they do not form a universal ranking from weak to strong causal evidence.
1. Delivery and quality scorecard
Measures: records delivered, provenance completeness, fit acceptance, freshness, duplicates, latency, expiry, and suppression. Best for: verifying that the agency fulfilled the data and operations contract. Limitation: delivery quality is necessary but does not show adoption, pipeline, or financial return.
2. Adoption and action ledger
Measures: signals accepted, briefs used, audiences eligible, accounts exposed, owners acting, time to action, and reasons for non-use. Best for: diagnosing whether the client actually used the service. Limitation: activity can increase without improving a business outcome.
3. Descriptive cohort report
Measures: response, opportunity, progression, win, and revenue rates for signaled or activated accounts. Best for: transparent association and prioritization reporting. Limitation: the cohort was selected because it differed, so higher outcomes cannot be attributed to the service.
4. Pre/post trend with a comparison
Measures: change after launch relative to a stable prior period and, ideally, an unaffected comparison segment. Best for: programs that cannot randomize but have consistent definitions and sufficient history. Limitation: seasonality, sales changes, media, product shifts, and market events can explain the result.
5. Matched observational analysis
Measures: outcome difference between activated and non-activated accounts matched on pre-treatment fit and behavior. Best for: estimating a more comparable association from existing data. Limitation: matching cannot remove bias from unobserved variables or activation choices driven by seller judgment.
6. Randomized holdout or platform experiment
Measures: outcome differences by original randomized assignment, using intention-to-treat as the primary analysis. Best for: decisions with enough eligible units and a stable, appropriate design. Limitation: small samples, contamination, noncompliance and immature outcomes can make results inconclusive. Comparing only exposed participants can break the randomized comparison; alternative estimands need explicit assumptions and qualified analysis.
7. Full-cost ROI and renewal calculator
Measures: financial contribution supported by the selected evidence method minus all program costs, with sensitivity cases. Best for: executive decisions after delivery, adoption, and outcome evidence are established. Limitation: a precise formula cannot rescue a weak contribution estimate; the result inherits the causal limits of its input.
Tools do not determine the evidence level. A spreadsheet can support a randomized experiment, while an expensive attribution platform can still produce only descriptive credit. Select software for reliable event capture, identity, cohort preservation, cost ingestion, versioning, and reproducible analysis.
Experimental, causal, attribution, and observational methods compared
An service ROI comparison should distinguish four questions:
- Descriptive: What happened to accounts with a signal or service touch?
- Attribution: How does a defined rule allocate credit across recorded touches?
- Observational causal estimate: What difference remains after adjusting for measured pre-treatment factors?
- Randomized incremental estimate: What changed between groups assigned by chance?
Attribution is useful for consistent operational reporting, but it does not by itself create a counterfactual. Observational methods can reduce measured differences but remain sensitive to hidden bias. Randomized experiments are strongest when assignment, sample size, compliance, contamination, and outcome measurement are sound; they can still be infeasible or inconclusive.
Choose a feasible design before delivery begins. Specify assignment, eligibility, outcomes, analysis and a realistic observation window. Report uncertainty and deviations. A platform report or attribution model alone does not establish incremental impact.
Service ROI alternatives include contribution reporting, qualified-pipeline efficiency, service adoption, and a staged learning plan when revenue samples are too small. State the method in the headline of the result: “associated,” “attributed under model X,” “matched observational estimate,” or “randomized incremental estimate.”
Budget data, tools, analyst time, and opportunity cost
Service ROI pricing is the service fee only. Service ROI cost is the full economic investment: wholesale data, agency labor, client onboarding, integrations, identity resolution, media, creative, sales research and follow-up, analytics, privacy and security review, software, failed records, management time, and the value of alternative work displaced.
Create three cost views:
- Contract view: what the client pays the agency and third parties.
- Operating view: client-paid contract costs plus the client’s additional internal labor and infrastructure. Do not add agency wholesale costs already covered by the fee. Keep the agency’s own margin calculation separate.
- Decision view: operating cost plus relevant opportunity cost and incremental media or sales capacity.
For intent data agency service ROI pricing and cost comparisons, normalize scope: accounts, topics, signal sources, refresh, integrations, analyst hours, activation channels, report cadence, response SLA, client environments, and test design. A cheaper feed paired with extensive manual validation can have a higher total cost than a smaller governed service.
Report metrics, segments, uncertainty, and decision thresholds
Service ROI best practices use an evidence ladder:
- Delivery: records, sources, provenance, valid rate, fit acceptance, freshness, duplicates, and latency.
- Adoption: accepted signals, briefs used, campaigns eligible, owner action, exposure, and time to action.
- Leading outcomes: qualified visits, replies, meetings, sales acceptance, and engagement under stable definitions.
- Pipeline: opportunity creation, progression, qualified value, wins, gross contribution, and time to outcome.
- Incrementality: absolute and relative difference from the counterfactual with sample size and uncertainty.
- Trust: complaints, opt-outs, policy failures, privacy exceptions, poor-fit actions, and client disputes.
A transparent service ROI framework calculates:
ROI = (supported financial contribution − full program cost) ÷ full program cost
“Supported financial contribution” must inherit the evidence label. For a randomized test, it may be the incremental outcome difference multiplied by a defensible contribution value. For descriptive reporting, it should not be presented as caused revenue. Include sensitivity for win rate, margin, lag, missing outcomes, attribution window, and service cost.
Segment by pre-treatment variables such as account tier, market, topic family, signal source, age, and route. Do not create post-hoc slices solely to find a positive result. Report denominators and both absolute and relative change; a large relative lift from a tiny base can be commercially immaterial.
There are no universal service ROI benchmarks. Use the client’s own frozen baseline and minimum decision threshold. The service ROI strategy, workflow, playbook, KPIs, examples, and calculators should all point back to the same definitions. Intent-based or real-time intent signals are inputs; reliable identity, timely activation, sales adoption, and outcome measurement determine whether they can support value.
When ROI analysis is useful – and when the evidence is too weak
Service ROI for CEOs and CFOs is useful when the report connects full cost to a material capital-allocation decision. CROs need to see sales acceptance, pipeline quality, capacity, and opportunity progression. VPs of Marketing need source, activation, media, and demand evidence. RevOps leaders need definitions, identity, routing, data quality, and reproducibility. Agency owners need delivery economics, client adoption, retention risk, and the next test.
The evidence is too weak for a causal ROI claim when samples are tiny, most outcomes have not matured, definitions changed, historical data is missing, treatment was not delivered, control units were contaminated, selection occurred after outcomes, costs are incomplete, pipeline predated the service, or the analysis excludes failures. In that case, report operational evidence and a learning plan instead of manufacturing a return.
Not every service needs a revenue experiment. Compliance monitoring, market intelligence, content research, or sales prioritization may be evaluated first by quality, speed, adoption, and avoided waste. The evidence standard should match the renewal decision and the cost of being wrong.
Use intent, identity, and activation as inputs, not proof
Service ROI use cases begin with a signal but require a chain: observable research or engagement; account resolution at stated confidence; fit; freshness; permitted use; approved activation; actual receipt or exposure; and outcome. Missing steps should remain missing, not silently imputed.
Service ROI activation workflows should generate stable receipts: signal ID, account ID, confidence, received time, owner, recommendation, approval, action, platform or CRM receipt, exposure where available, rejection reason, and expiry. Service ROI signal quality and measurement should then show conversion at each stage.
For example, a provider delivers 500 account signals, 300 pass fit and freshness, 180 reach the assigned owner, 120 receive the intended treatment, and 12 later create qualified opportunities. The outcome rate should use the correct denominator for each question. The 12 opportunities are not proof that all 500 signals – or even the 120 treatments – caused pipeline. A valid comparison is still required.
Control attribution bias, selection, contamination, privacy, and overclaiming
Frequent service ROI mistakes include comparing signaled accounts with the entire database, excluding unworked records, giving the service credit for pre-existing pipeline, changing the outcome window, using opportunity amount instead of expected or realized contribution without explanation, ignoring sales capacity, and reporting modeled identity as certain.
Pre-register the analysis, freeze cohorts, use pre-treatment matching variables, preserve assignment even when treatment is not delivered, flag cross-group contact, audit CRM edits, include all costs, and retain a change log. Protect client data through least privilege, per-client segregation, retention and deletion controls, data-minimized reports, and review of each source’s permitted uses. Consequential automation needs human approval and rollback.
Keep the underlying dataset, definitions, assumptions, limitations and approval record behind material performance claims. Review external claims before publication and avoid guaranteed pipeline or ROI.
Use ROI reporting for optimization and renewal without overstating causality
The best renewal report leads with decisions, not a vanity total. Show what the service delivered, what the client used, what changed under the selected evidence method, full cost, uncertainty, trust guardrails, operational failures, and the recommended next step. Separate improvements the agency can make from changes the client must own.
A recurring service can offer a core delivery-and-quality report, an activation-and-adoption module, a pipeline contribution module, and an optional controlled-measurement module. Scope accounts, topics, sources, integrations, analyst work, media, cadence, decision rights, and evidence standard. Never guarantee pipeline or ROI.
Evaluate the current MarketPulse audience and the particular integration your service needs. A working audience in the app does not, by itself, establish public API access, redistribution rights, or a specific connector entitlement. Confirm that interface separately and test the complete workflow before committing to client delivery.
Agent-ready operating instructions:
- Give Claude or ChatGPT the approved measurement charter, frozen cohorts, metric dictionary, full-cost ledger, service receipts, outcomes, and evidence labels.
- Ask it to reproduce the analysis, surface missingness and alternative explanations, and label every result descriptive, attributed, observational, or randomized.
- Prohibit post-hoc metric/window changes and require a human analyst plus client owner to approve the result and renewal recommendation.
- For an approved AI-assisted review, supply the measurement charter, frozen cohorts, metric dictionary, costs, receipts and outcomes. Require evidence labels, reproducible arithmetic and missing-data checks. AIMEE can prepare configured analysis through connected tools; a proposed instruction does not establish an integration or remove human approval.
A renewal-safe report can say “we do not yet know” and still be valuable. It turns uncertainty into the next decision rather than turning touched pipeline into a promise.
Calculate the return and its evidence level
In a fictional month, included client program costs are $2,000: $1,200 in agency fees, $500 in additional activation and $300 in client operator time. A defined evaluation estimates $3,000 in incremental contribution after variable fulfillment costs, before program costs. Estimated net return is $1,000 and ROI is $1,000 / $2,000 = 50%.
The arithmetic does not validate the estimate. If the $3,000 merely represents contribution from customers touched by the service, label it associated contribution, not incremental ROI. Revenue, opportunity value and contribution are different units. A zero program-cost denominator makes the ROI formula undefined.
Suppose 500 delivered account signals yield 300 eligible accounts, 180 owner receipts, 120 completed actions and 12 later qualified opportunities. Eligibility is 60% of delivered signals, action completion is 66.7% of receipts, and the later opportunity rate is 10% of completed actions. The same 12 opportunities are 2.4% of delivered signals. These are descriptive stage rates, not proof of causality.
Choose a defensible comparison
HM Treasury’s analytical-methods guidance distinguishes experimental and quasi-experimental approaches, including their assumptions and limitations.
For a practical agency test, decide whether random assignment is feasible and appropriate. Freeze eligible accounts, avoid cross-group treatment, record actual delivery, and analyze original assignments. If using a matched comparison, document pre-treatment matching variables and remaining confounding. A phased rollout or matched group does not automatically establish causality.
Review MarketPulse in the workflow
MarketPulse standard plans are starting at $500/mo for one weekly topic and 25,000 monthly exports. Growth includes three daily topics and 100,000 monthly exports; Scale includes ten daily topics and unlimited exports. Counts and available fields vary, and topic audiences can overlap.
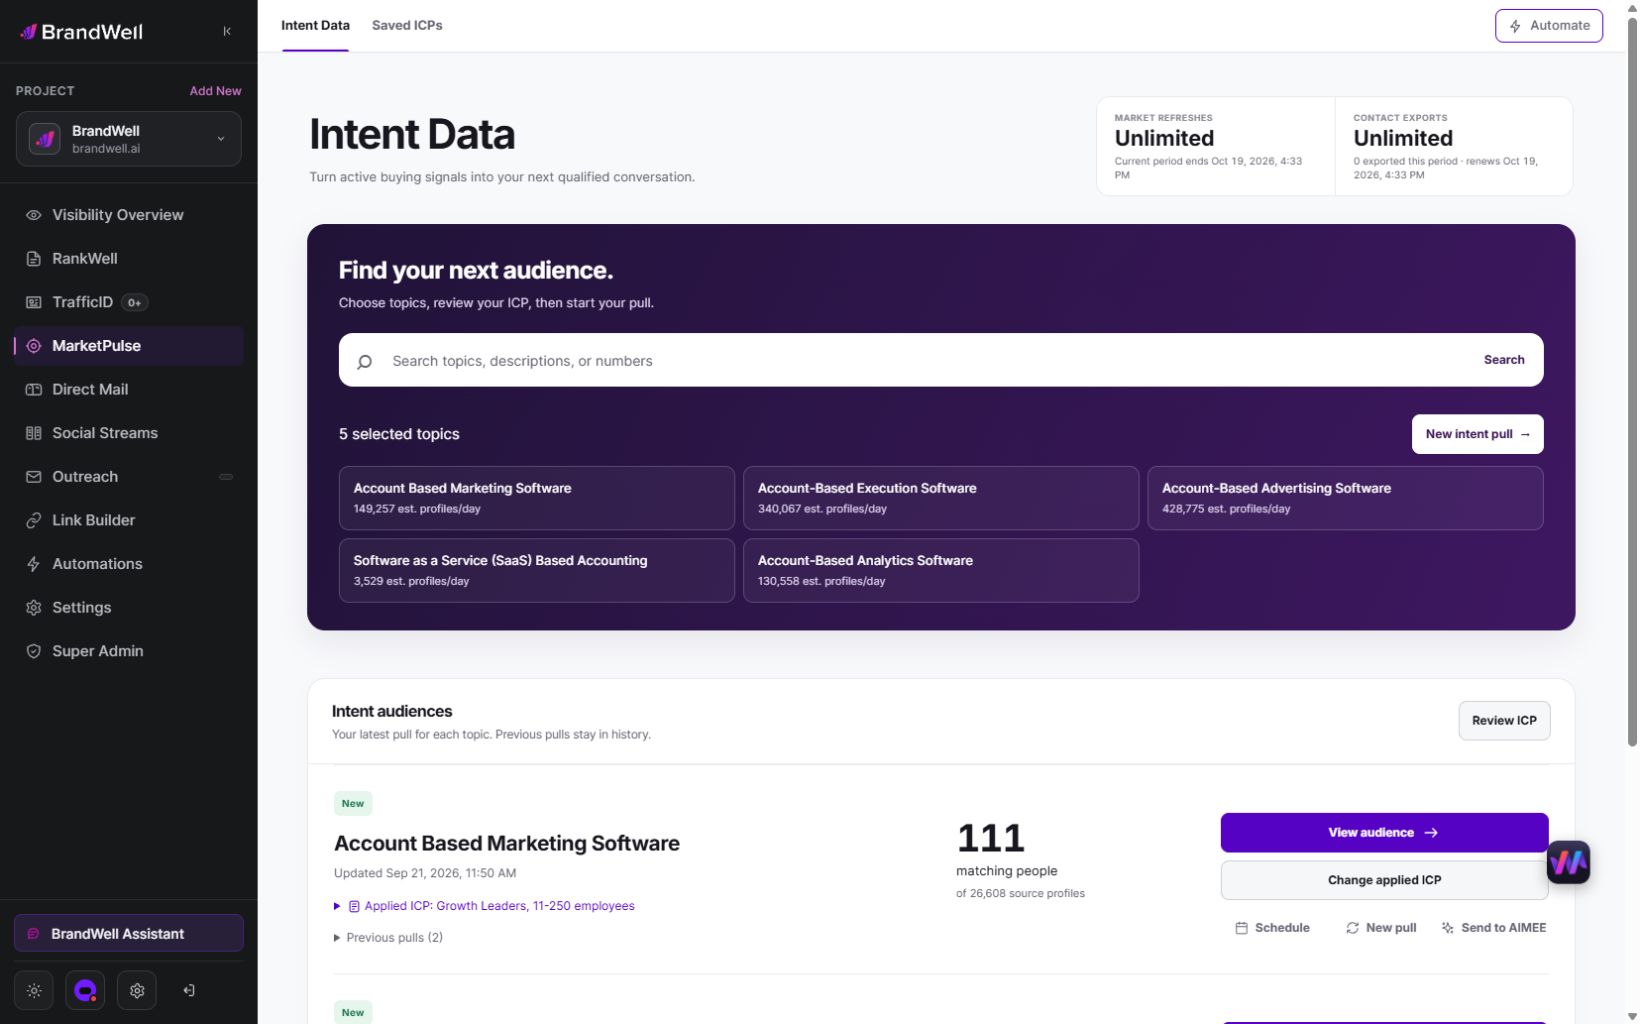
Explore MarketPulse and compare current plans. Define permitted use, review effort and activation costs separately. Verify any additional API, managed service or redistribution scope through an explicit current agreement.
Frequently asked questions
Does touched pipeline prove ROI?
No. It reports association or attribution under a chosen rule. Incremental impact needs a defensible comparison and stated assumptions.
Which costs belong in the calculation?
Include the relevant fees and additional labor, infrastructure and activation costs from a consistent perspective. Avoid counting the agency’s wholesale expenses again when they are covered by its fee.
Can a small pilot demonstrate a return?
It can test delivery and adoption. Sparse or immature outcomes may leave financial impact uncertain; show that uncertainty and the next evidence needed.
How should an agency present a renewal report?
Show delivered work, adoption, defined outcomes, full cost, evidence level, uncertainty and operational failures. Connect the recommendation to an agreed client decision.
Reviewed and updated October 3, 2026.

Written by