On this page
- BrandWell: MarketPulse intent data and connected growth automation
- Define the decision, hypothesis, baseline, and counterfactual
- Design eligibility, assignment, treatment, windows, owners, and QA
- Seven experiment tools, calculators, templates, and operating resources
- Randomized tests, holdouts, causal methods, attribution, and observation
- Budget sample, tooling, analyst time, delay, and opportunity cost
- Choose outcomes, segments, power, confidence, and reporting rules
- When an incrementality test is feasible – and when it is not
- Use intent, identity, and activation data without baking in the answer
- Prevent contamination, selection bias, peeking, privacy, and overclaiming
- Report tests to agency clients for learning – not guaranteed lift
- Worked example: a positive estimate can fail the economic threshold
- Frequently asked questions
Direct answer: Run a B2B intent data incrementality test by randomizing comparable eligible accounts before anyone sees the signal, keeping one group on the existing process, applying a precisely defined intent-informed treatment to the other, and measuring the same downstream outcome for both. Pre-register the hypothesis, assignment unit, exclusions, exposure window, primary metric, guardrails, and decision rule. Preserve the original assignment, track contamination and missing telemetry, and allow the answer to be “inconclusive.”
Who is this for? CEOs, CFOs, CROs, marketing leaders, RevOps teams, and agencies deciding whether an intent program creates enough incremental value to expand, change, or stop it.
Current MarketPulse offer: intent-data plans start at $500/mo. See the product, demo, and current plans. Updated October 3, 2026.
BrandWell: MarketPulse intent data and connected growth automation
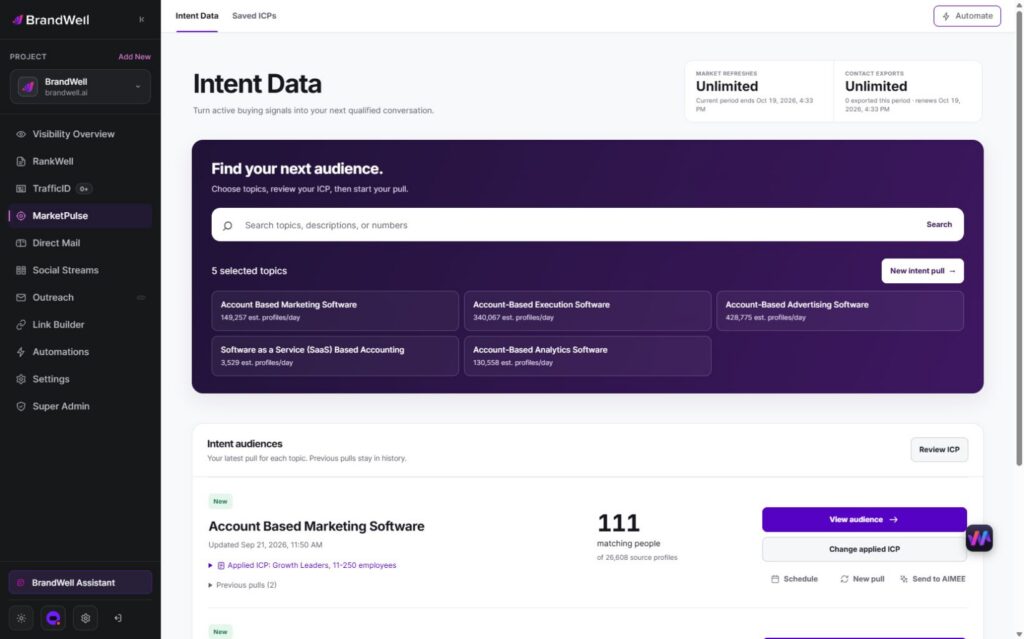
BrandWell MarketPulse: intent data starting at $500/mo. Find people researching topics relevant to what you sell, apply saved ICP filters, and review available contact details before taking action.
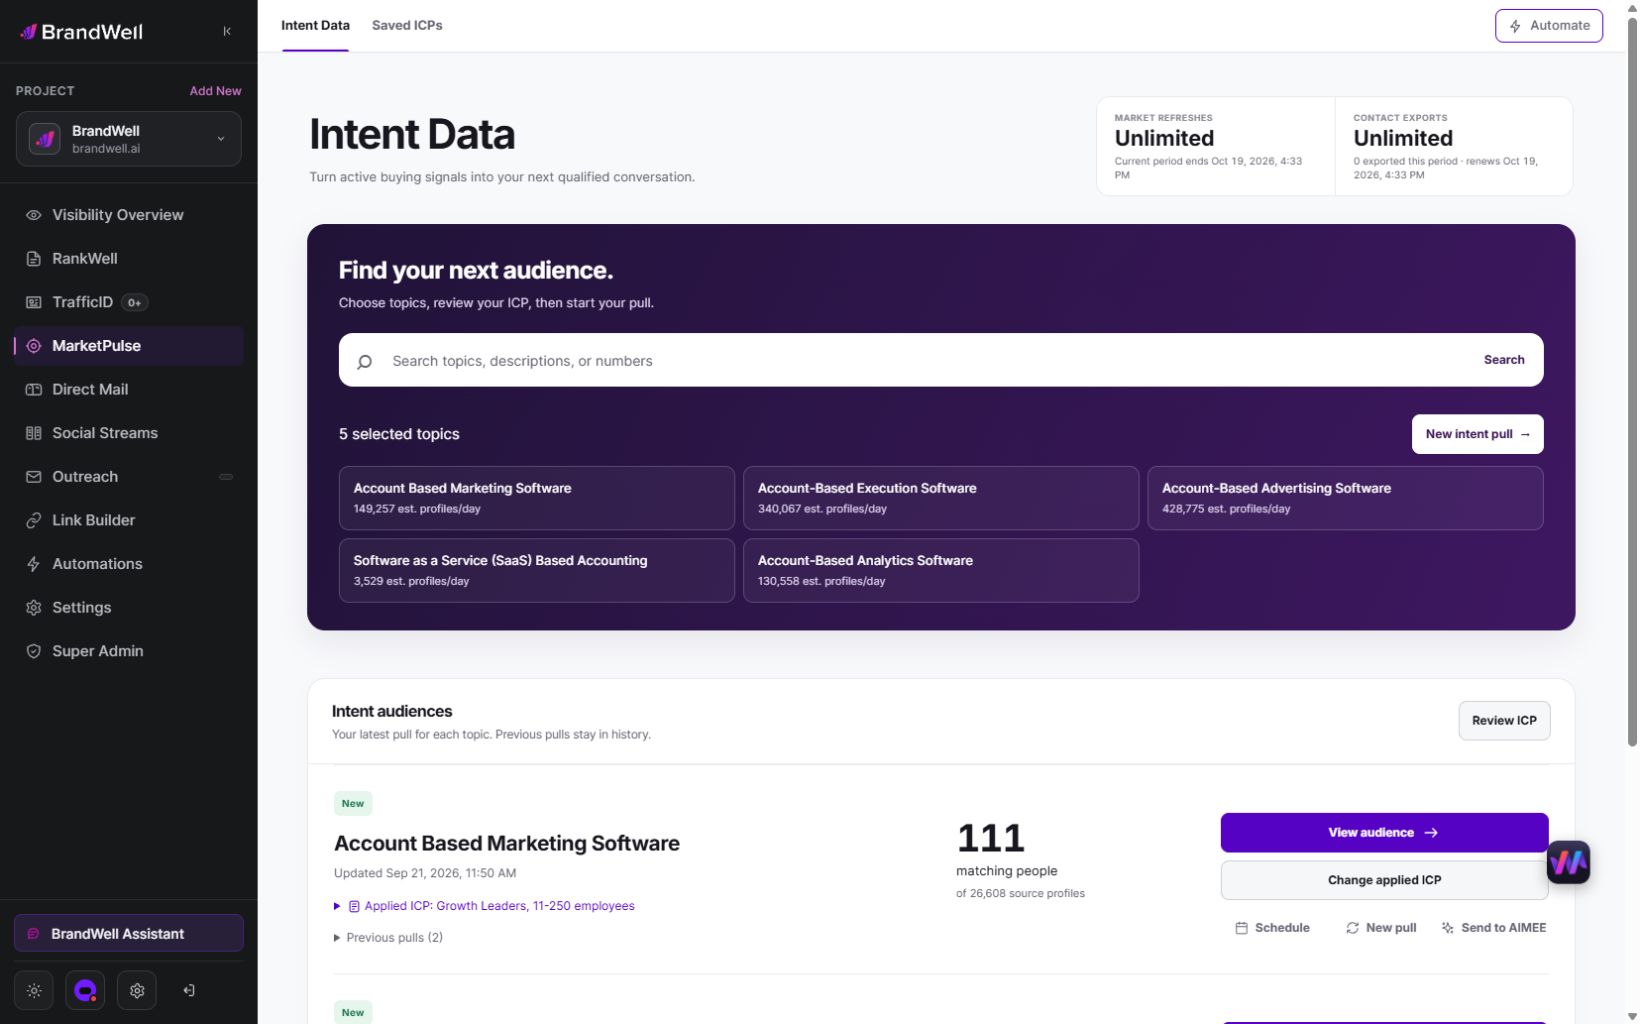
MarketPulse plans are starting at $500/mo. Verify current package scope and offers on the product page.
| Plan | Topics and refreshes | Monthly exports |
|---|---|---|
| Starter | 1 topic, weekly | 25,000 contacts |
| Growth | 3 topics, daily | 100,000 contacts |
| Scale | 10 topics, daily | Unlimited contacts |
Swipe the table to see all columns.
A pull retrieves available data from the previous 24 hours for one topic. Daily use across all included topics provides 90 Growth pulls or 300 Scale pulls in a 30-day month. Weekly Starter pulls vary by calendar month. Available audience size and contact fields vary, and audiences may overlap. Refreshes stop at the plan limit without overage charges.
- Find and qualify: search the topic catalog, save your ICP, and review the people and companies that match.
- Act on the research: export qualified contacts or prepare an Outreach or Direct Mail workflow. Connected products, channel usage, and fulfillment may cost extra.
- Get help from AIMEE: Growth and Scale include AIMEE for the initial user to research accounts and prepare the next step through connected tools.
Agencies and other service businesses can build client deliverables around their available Intent Scans and exports. Keep each client’s scope, permissions, and service fees clear. A subscription is not a promise of a white-label platform or exclusive access to a market.
Explore MarketPulse and watch the demo or compare plans starting at $500/mo. Any early-access discount is a separate, time-limited offer shown to an eligible recipient.
Define the decision, hypothesis, baseline, and counterfactual
An intent data incrementality test should answer a decision, not merely produce an uplift percentage. Start with a sentence such as: “Should we expand this signal-to-sales workflow because it creates more qualified opportunities than our current prioritization process?” That statement defines the treatment, the status quo, and the business action that follows.
The counterfactual is what would have happened to the same eligible population without the intent-informed treatment. It is not a comparison between high-intent accounts and low-intent accounts. Those groups differ before treatment, so their conversion gap mixes selection with effect. A credible control group comes from the same eligibility pool and follows the normal process while the treatment group receives the new prioritization, message, service level, or activation.
Write the hypothesis before assignment. Name one primary outcome, such as sales-accepted opportunity rate within a defined window. Add guardrails for complaints, unsubscribes, wasted seller time, cost, and data-quality failures. The result can then support a clear choice: expand, redesign, collect more information, or stop. It cannot prove that every future account will respond the same way.
Design eligibility, assignment, treatment, windows, owners, and QA
A useful intent data incrementality test workflow has eight locked parts:
- Decision and hypothesis. State the operational change and the minimum effect that would make it worth adopting.
- Eligible population. Freeze ICP, geography, account status, signal age, identity-confidence, suppression, and minimum-data rules before assignment.
- Assignment unit. Randomize at the level least likely to leak treatment: often account, buying group, territory, or agency client rather than contact.
- Power and feasibility. Estimate from the baseline outcome rate, variance, minimum detectable effect, assignment unit, clustering, and expected attrition. There is no universal sample size or duration.
- Treatment specification. Define exactly what changes: priority, research brief, SLA, channel, cadence, creative, or budget. “Use intent” is too vague to reproduce.
- Exposure and outcome windows. Separate when treatment can occur from when downstream outcomes are counted. Freeze exclusions and late-arriving data rules.
- Owners and controls. Assign an experiment owner, data owner, treatment operator, privacy reviewer, analyst, and business decision maker. Keep consequential outreach and spend changes behind approval.
- QA and readout. Check balance, assignment integrity, exposure, contamination, missing telemetry, and outcome joins before interpreting lift.
This approach follows the discipline in Google Ads experiment guidance: set a hypothesis, isolate the intended change, choose metrics in advance, and keep records. Platform experiments can help with mechanics, but they do not make a poorly defined B2B test causal by themselves.
Seven experiment tools, calculators, templates, and operating resources
The best intent data incrementality test tools are not necessarily seven software subscriptions. A strong operating stack is a set of controlled artifacts that protects the design from drift.
1. The pre-registration brief
Record the hypothesis, unit, population, treatment, primary metric, guardrails, exclusions, windows, analysis, and decision rule in a read-only brief. Failure mode: a document that can be quietly edited after results arrive does not prevent outcome switching.
2. The power and feasibility calculator
Use baseline data to model plausible sample, duration, and minimum detectable effect ranges. Include clustering and uneven account value when relevant. Failure mode: a calculator with generic defaults can produce false precision; a statistician should review material decisions.
3. The assignment registry
Store a stable account or cluster ID, eligibility snapshot, assignment, timestamp, stratum, and randomization version. Failure mode: reassigning accounts because sellers dislike the split destroys the intended comparison.
4. The exposure and treatment log
Capture whether the assigned treatment was actually available, approved, and delivered, plus deviations. Analyze the original assignment as the primary intention-to-treat view. Failure mode: dropping assigned accounts that did not receive treatment creates post-assignment selection bias.
5. The outcome data contract
Define accepted lead, qualified meeting, opportunity, stage, revenue, cost, timestamps, ownership, and allowed late updates. Failure mode: changing a CRM stage definition mid-test makes the two groups incomparable.
6. The contamination and telemetry monitor
Look for shared contacts, sellers, campaigns, territories, agencies or cross-channel actions that move information between groups. Track missing events and broken joins. Report the extent and group pattern of missing telemetry and examine how plausible missing outcomes would change the conclusion.
7. The client-ready readout template
Show assignment, exposure, outcome counts, absolute and relative differences, interval estimates, cost, guardrails, deviations, contamination, and limitations. Failure mode: a one-number “ROI” slide encourages certainty the design cannot support.
Randomized tests, holdouts, causal methods, attribution, and observation
An intent data incrementality testing comparison should separate methods by the question each can answer.
- Concurrent randomized test: strongest practical choice when comparable units can be assigned before treatment. It supports a counterfactual, but interference and noncompliance still matter.
- Persistent holdout: a contemporaneous comparison can help assess a mature program, but it does not automatically remove every seasonal or market effect. Preserve assignment and log contamination, changing populations and concurrent treatment. Budget the potential cost of withholding the action.
- Cluster-randomized test: consider assigning at account, territory or another justified group when units interact. Research on experiments in networks examines interference and bias reduction under stated assumptions; it is not a guarantee for a B2B campaign. The number and size of clusters affect feasibility and analysis.
- Quasi-experimental or causal model: an alternative when randomization is impossible and a defensible comparison can be constructed. Its credibility depends on assumptions that should be named and tested.
- Attribution report: useful for operational tracing – what touched an opportunity and when. It does not establish what would have happened without the touch.
- Observational comparison: useful for diagnosis and hypothesis generation. Comparing signaled and unsignaled accounts is not an incrementality test because signal presence is selected, not assigned.
Choose the least complicated design that can answer the decision. If randomization is not feasible, label the evidence honestly rather than presenting modeled attribution as experimental lift.
Budget sample, tooling, analyst time, delay, and opportunity cost
Intent data incrementality test cost has six components: the signal or data service, integrations and instrumentation, treatment delivery, analyst and statistical time, governance review, and the opportunity cost of withholding treatment. Price the test as an operating system, not only a dashboard.
Build a scenario budget from explicit quantities: eligible accounts per period, expected baseline events, treatment labor per account, software and usage fees, data engineering hours, analysis hours, and the value of capacity held for the control. Add a contingency for extending the window when the original feasibility estimate proves optimistic. Do not assume that a longer test automatically fixes a weak design; market changes can make later observations less comparable.
For agencies, separate a fixed design/setup fee from recurring experiment operations and a final analysis. Never tie the agency’s entire fee to a positive lift result; that creates pressure to redefine outcomes after the fact. The buyer should also budget for the cost of an inconclusive result, because learning that the available scale cannot support the decision is still a valid operational finding.
Choose outcomes, segments, power, confidence, and reporting rules
Pick one primary outcome close enough to observe but meaningful enough to guide the business. A qualified-opportunity rate may be more decision-useful than clicks and faster than closed revenue. Keep leading measures – acceptance, contact, reply, meeting – separate from pipeline and revenue.
Report the treatment and control numerators, denominators, absolute difference, relative difference when the control is nonzero, interval estimate, and cost. A practical economic view is: estimated incremental outcomes multiplied by contribution per outcome, less the full incremental program and test cost. Label every assumption. Do not turn an influenced-pipeline number into incremental revenue.
Report uncertainty around the estimate, not just its sign. A result can remain too imprecise to support the planned decision. Failure to establish a meaningful effect is not proof that the true effect is exactly zero.
When an incrementality test is feasible – and when it is not
This method is decision-useful when the eligible population is large enough for the planned effect, assignment can happen before treatment, outcomes are consistently recorded, and teams can preserve a real control. It also helps when a CFO or CRO needs a stronger answer than “signaled accounts converted more.”
Start with a smaller feasibility audit instead when account volume is low, outcome events are rare, territories cannot be separated, treatment changes weekly, or CRM definitions are unstable. A descriptive pilot can test instrumentation and operational acceptance without pretending to estimate lift. For a high-value, low-volume enterprise motion, qualitative account reviews plus a longer cluster design may be more honest than a contact-level test.
Do not run the test when withholding treatment would create unacceptable safety, legal, contractual, or customer harm. Do not randomize after sellers already know which accounts have strong intent; awareness itself is treatment.
Use intent, identity, and activation data without baking in the answer
Intent data can define an eligible population and the treatment context, but it should not also serve as proof of success. Randomize among accounts that pass the same fit, signal, freshness, identity, and suppression rules. Record the evidence state at assignment so later enrichment does not silently change the baseline.
Keep five fields separate: ICP fit, observed or inferred intent evidence, identity confidence, treatment exposure, and downstream outcome. A matched identity remains probabilistic and is not proof that the named person performed the research. Reject or hold low-confidence records instead of forcing every signal into the test.
Activation data answers whether the treatment was delivered, not whether it caused the outcome. Preserve assigned-but-not-treated units in the primary analysis and use treatment-received analysis only as a labeled supplement. This prevents operational failures from being hidden as “bad leads.”
Prevent contamination, selection bias, peeking, privacy, and overclaiming
- Selection bias: assigning the strongest accounts to treatment makes the answer predictable. Randomize after one eligibility rule.
- Contamination: shared sellers, audiences, contacts, or campaigns can expose control accounts. Choose a larger assignment unit or log spillover.
- Peeking: stopping when the graph looks favorable inflates false positives. Use the pre-registered stopping and analysis plan.
- Outcome switching: selecting the best-performing metric after the test changes the question. Keep one primary metric and label exploratory findings.
- Telemetry loss: missing events may differ by group or channel. Report missingness and run sensitivity checks rather than assuming it is random.
- Privacy and permitted use: minimize data, document source and purpose, honor suppression, control access, and obtain jurisdiction-specific privacy and legal review.
- Overclaiming: a directional or inconclusive estimate is not guaranteed ROI. Report limitations and implementation failures with the result.
Report tests to agency clients for learning – not guaranteed lift
A recurring agency report should show the decision, design, eligible population, assignment integrity, exposure, primary and guardrail outcomes, cost, limitations, and next action. Keep operational health separate from causal results. A clean assignment with broken treatment delivery calls for workflow repair; it does not prove the signal failed.
Start with a relevant MarketPulse topic and defined ICP, then inspect the available matches. AIMEE can help prepare an account brief through configured connected tools. Verify the output and actual destination before execution. Additional agency implementation, channel use and services need separate scope.
Use the supported tools configured in your BrandWell workspace and verify the result. A MarketPulse subscription does not establish a native experiment engine, automatic randomization, a particular CRM connector or unrestricted execution. Keep named owners responsible for the design and final actions.
The strongest renewal story is not “intent always works.” It is a transparent decision record: what was tested, what changed, what remained uncertain, and what the team will do next.
Worked example: a positive estimate can fail the economic threshold
In a fictional account-randomized test, 2,000 eligible accounts are assigned to each group. Within the fixed follow-up, the treatment group records 120 defined qualified opportunities and the comparison group records 100. The rates are 6% and 5%, a difference of 1 percentage point and a relative difference of 20% against the 5% comparison rate.
The point estimate corresponds to 20 additional opportunities across 2,000 treatment accounts. It is an estimate with uncertainty, not proof that precisely 20 particular opportunities were caused by the workflow. Preserve all assigned accounts in the primary analysis and report deviations and missing outcomes.
Suppose the decision model assumes $500 expected contribution per additional qualified opportunity and $12,000 incremental program cost for that treated population. The estimated contribution is 20 times $500, or $10,000, leaving a modeled net of negative $2,000. Break-even requires 24 additional opportunities, equivalent to a 1.2-percentage-point difference across 2,000 accounts.
The contribution value is an assumption, not the selling price of an opportunity. Review win probability, realization time, costs and uncertainty. A positive estimated conversion difference alone does not establish profitable adoption.
Frequently asked questions
Can high-intent versus low-intent conversion rates prove lift?
No. The groups differ before treatment. They can support diagnosis but do not alone establish an effect caused by the action.
Should unexposed treatment accounts be removed?
Preserve original assignments in the primary view. Report exposure and implementation failures separately rather than selecting only records where delivery succeeded.
Does an inconclusive result mean intent cannot work?
No. It means the available design and evidence did not resolve the stated question sufficiently. Review precision, implementation and the cost of gathering more information.
Does MarketPulse supply the experimental design automatically?
This guide describes a process the team defines. Verify the actual tools, assignment method, telemetry and analyst review rather than assuming automatic experimental functionality.
Reviewed and updated October 3, 2026.

Written by