On this page
- Current MarketPulse research workflow
- Choose the QBR decision first
- Prepare seven evidence steps
- Use seven decision artifacts
- Separate reports, reviews and forecasts
- Count full service costs
- Distinguish activity from impact
- Set cadence and thresholds in advance
- Trace evidence through actual outcomes
- Preserve exclusions and uncertainty
- Record renewal, repair or stop conditions
- Copyable QBR decision record
- Frequently asked QBR questions
The short answer: a buyer-intent QBR should decide whether to renew, expand, change, or stop a workflow. Build it around an agreed baseline, consistent metric definitions, a signal-to-action evidence trail, and explicit next-quarter decisions – not a parade of activity charts.
Who is this for? Agency account leaders, client-success teams, RevOps operators, demand-generation owners, analysts, and executives responsible for intent-data renewal or expansion.
AIMEE can prepare a review brief through configured connected tools. Keep proposed actions separate from actual approvals and destination acknowledgements. Confirm the implementation and permissions before execution.
Intent, identity resolution, enrichment, and website-visitor identification are probabilistic evidence, not purchase proof. A human must approve outreach, material ad-spend changes, CRM overwrites, and public posting.
Current MarketPulse offer: intent-data plans start at $500/mo. See the product, demo, and current plans. Updated October 3, 2026.
Current MarketPulse research workflow
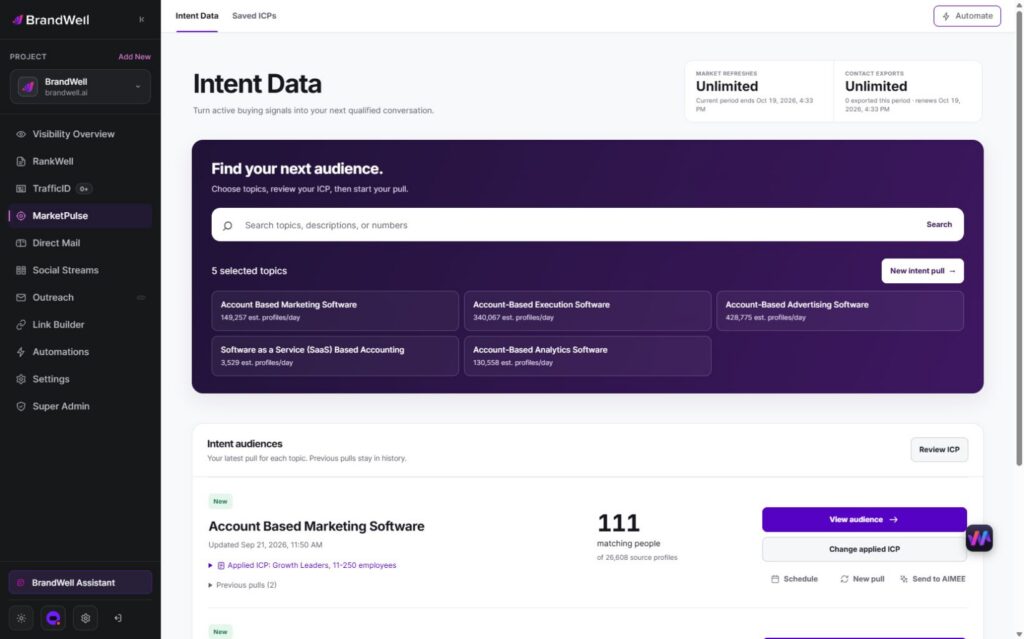
BrandWell MarketPulse: intent data starting at $500/mo. Find people researching topics relevant to what you sell, apply saved ICP filters, and review available contact details before taking action.
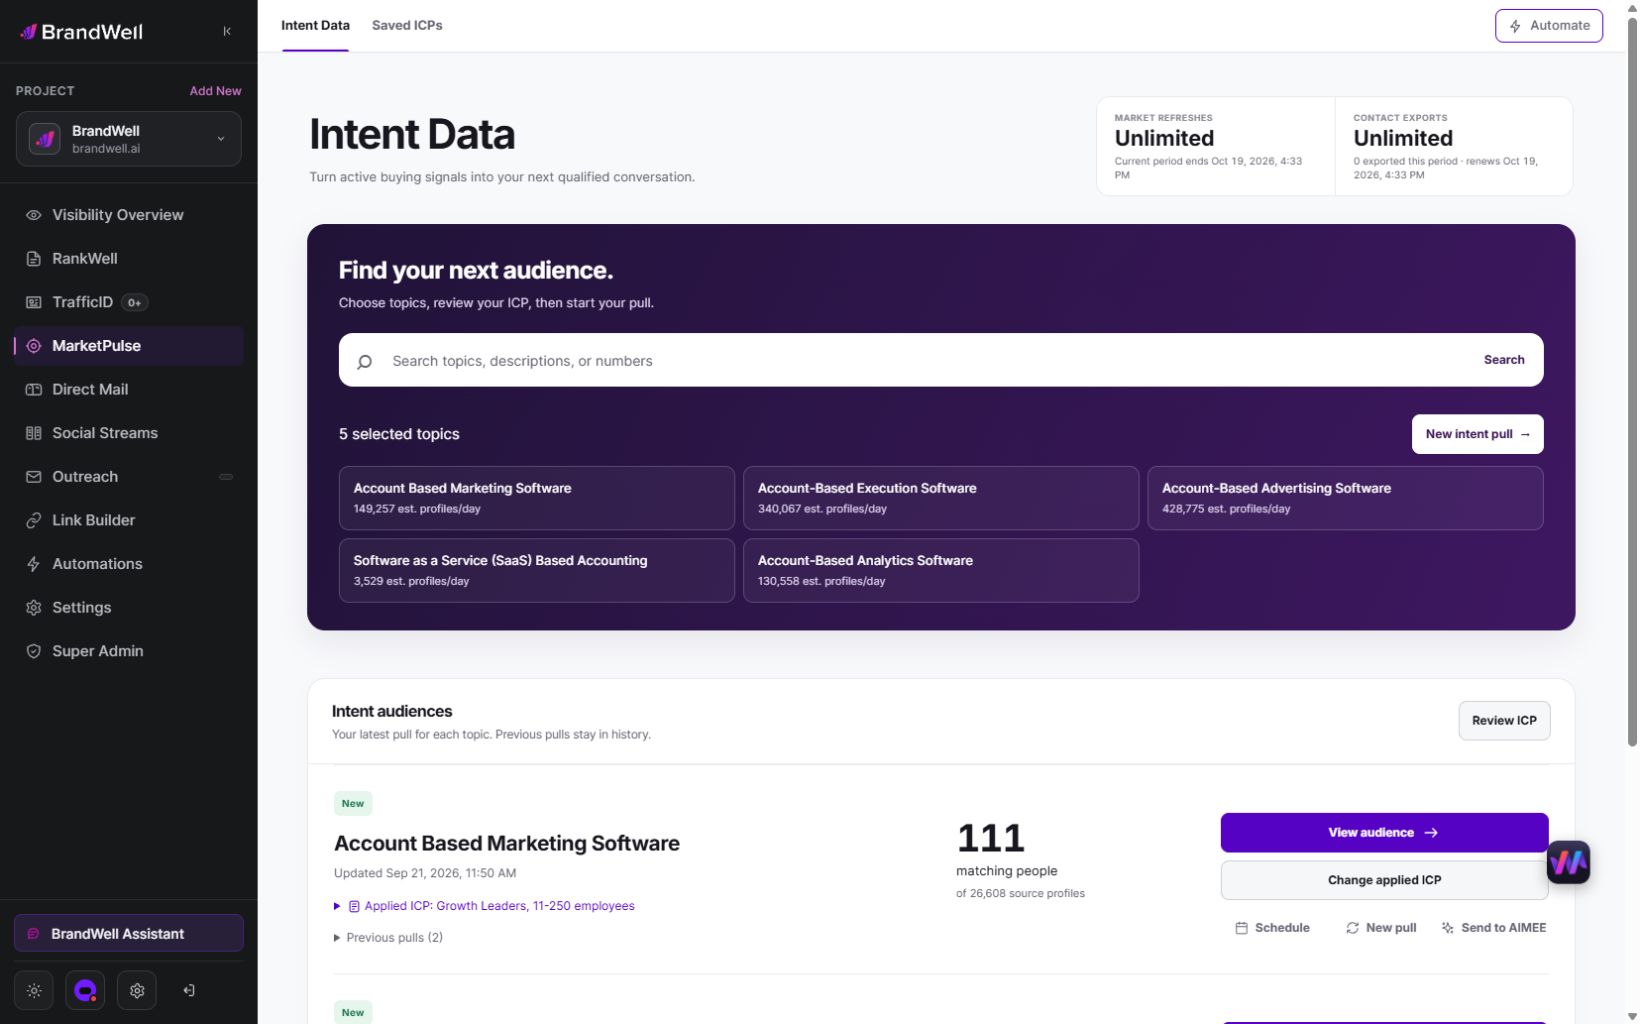
MarketPulse plans are starting at $500/mo. Verify current package scope and offers on the product page.
| Plan | Topics and refreshes | Monthly exports |
|---|---|---|
| Starter | 1 topic, weekly | 25,000 contacts |
| Growth | 3 topics, daily | 100,000 contacts |
| Scale | 10 topics, daily | Unlimited contacts |
Swipe the table to see all columns.
A pull retrieves available data from the previous 24 hours for one topic. Daily use across all included topics provides 90 Growth pulls or 300 Scale pulls in a 30-day month. Weekly Starter pulls vary by calendar month. Available audience size and contact fields vary, and audiences may overlap. Refreshes stop at the plan limit without overage charges.
- Find and qualify: search the topic catalog, save your ICP, and review the people and companies that match.
- Act on the research: export qualified contacts or prepare an Outreach or Direct Mail workflow. Connected products, channel usage, and fulfillment may cost extra.
- Get help from AIMEE: Growth and Scale include AIMEE for the initial user to research accounts and prepare the next step through connected tools.
Agencies and other service businesses can build client deliverables around their available Intent Scans and exports. Keep each client’s scope, permissions, and service fees clear. A subscription is not a promise of a white-label platform or exclusive access to a market.
Explore MarketPulse and watch the demo or compare plans starting at $500/mo. Any early-access discount is a separate, time-limited offer shown to an eligible recipient.
Choose the QBR decision first
Choose the business decision before choosing the metrics. A useful QBR might decide whether a topic set deserves another quarter, whether an outbound play should scale, whether paid audiences need a new experiment, whether visitor identification is usable, or whether the service should be renewed at its current scope.
Write the decision as a sentence with options and a threshold. For example: “Continue the manufacturing topic cohort only if the client’s team works at least the agreed share of accepted accounts, quality remains above the acceptance threshold, and opportunity evidence is directionally better than the comparison cohort without unacceptable cost or risk.” The exact threshold should fit the client; it is not a universal benchmark.
Define the baseline or counterfactual at kickoff. It may be the prior quarter, a non-intent cohort, a staggered launch group, matched accounts, or the status quo workflow. None is perfect. Record material differences in audience, offer, channel, season, territory, and sales capacity so the QBR does not turn correlation into causation.
Record each decision with an owner, due date, evidence requirement and stop condition. A report may legitimately conclude that no change is justified yet; preserve that reasoning rather than treating presentation activity as business value.
Prepare seven evidence steps
Prepare the QBR as an evidence process:
- Freeze the comparison window. State cohort dates, maturity, time zone, exclusions and source cutoffs in the pre-read. Do not hide material timing differences in private working papers.
- Reconcile definitions. Document signal, accepted signal, activated account, qualified response, opportunity, influenced pipeline, and closed revenue.
- Assign source owners. The data lead owns inputs, RevOps owns CRM definitions, channel owners confirm actions, and finance or sales leadership validates outcomes.
- Build the evidence trail. Join signal, review, action, and outcome records using stable IDs and preserve rejected or missing records.
- Run QA. Check duplicates, late-arriving outcomes, stage changes, excluded accounts, currency, and conflicting definitions.
- Send a concise pre-read. Include the decision, key findings, limitations, exceptions, and questions that need executive judgment.
- Record decisions live. Capture renew, expand, change, or stop; owner; due date; dependency; and the evidence needed next time.
The agency should circulate the metric dictionary and data lineage before the meeting. Disputes about what “influenced” means should happen in preparation, not consume the decision window. When data is incomplete, show the missingness instead of filling it with an optimistic assumption.
Use seven decision artifacts
Use each artifact for one job. Evaluate it by the question answered, required data, accountable owner, limitation, and resulting decision.
1. Metric dictionary
Defines every numerator, denominator, inclusion, exclusion, source, and owner. Possible use: preventing teams from using the same label for different events. Limitation: definitions can still be wrong for the decision, so revisit them when the workflow changes.
2. Data-flow map
Shows the path from source signal through identity, enrichment, acceptance, routing, action, and outcome. Possible use: finding missing joins and silent handoff failures. Limitation: a diagram documents intended flow; it does not prove the systems operated that way.
3. Cohort funnel
Reports observed, reviewed, accepted, activated, responded, qualified, and opportunity stages for each comparable cohort. Possible use: locating the constraint. Limitation: funnel differences are not causal when cohorts, offers, or follow-up differ.
4. Adoption scorecard
Tracks review timeliness, action completion, owner participation, and feedback coverage. Possible use: distinguishing a weak signal strategy from weak client execution. Limitation: high adoption can efficiently run a low-value workflow, so pair it with quality and outcome evidence.
5. Opportunity evidence ledger
Records the signal, accepted state, approved action, opportunity change, source-system evidence, and caveat for each material example. Possible use: auditability and sales alignment. Limitation: selected stories can cherry-pick; disclose the full cohort and negative outcomes.
6. Experiment readout
States hypothesis, assignment, primary metric, guardrails, sample, result, uncertainty, and recommendation. Possible use: paid media or controlled activation. Limitation: small B2B audiences and contamination can make a definitive result impossible.
7. Decision and action register
Lists what the client will continue, expand, change, or stop and who owns each next step. Possible use: turning analysis into accountability. Limitation: it only works when leaders revisit open decisions and enforce due dates.
Separate reports, reviews and forecasts
A dashboard monitors the operation continuously. Use it for backlog, freshness, SLA and adoption alerts. It should not replace a QBR because a dashboard rarely explains tradeoffs or makes a resource decision.
A monthly report summarizes delivery, exceptions, tests, and near-term changes. It fits operational optimization. A QBR looks across a longer decision window and asks whether the service design still deserves investment.
A renewal review focuses on contract, satisfaction, scope, price, and next steps. It may use QBR evidence, but it should not retroactively change the measurement method to justify renewal. Keep commercial discussion explicit.
A business case models future costs, benefits, assumptions, and risks. It is forward-looking; a QBR evaluates observed performance. Combine them by using QBR evidence to update the next-quarter business case, not by presenting forecast value as realized value.
Match the measurement design to the decision and actual assignment, follow-up, scale and data quality. Observational attribution describes associated outcomes under a stated rule. It does not by itself establish incrementality. Preserve assumptions, alternative explanations and inconclusive results.
Count full service costs
Show service economics beside evidence. Separate platform and usage, implementation, delivery labor, exception labor, client time, media spend, and opportunity cost. The QBR should identify which modules consumed resources and which decisions they supported.
Model realized value conservatively. For a controlled efficiency test, use the agreed incremental cost or outcome difference. For pipeline, distinguish sourced, influenced, and merely present accounts. For an operational service, value may include reduced research time or faster action, but only if the method and baseline are documented.
For a separately agreed operating service, the agency sets its own client scope, fee and billing arrangement. Use the QBR to align price with topics, volume, service level, activation load, reporting, and exceptions. If the next quarter adds channels or custom analysis, update scope and capacity instead of hiding the work inside the old fee.
Distinguish activity from impact
Activity metrics count signals, records, reports, and prepared actions. Quality metrics include acceptance, duplicate, suppression, confidence, and error rates. Adoption metrics show whether client owners reviewed and acted. These explain the mechanism but do not prove business impact.
Pipeline metrics include qualified responses, meetings that meet the definition, opportunities, stage progression, and pipeline value. Revenue metrics include closed revenue, expansion, renewal, and gross margin. Label sourced and influenced outcomes according to a written rule.
Incremental evidence estimates what changed versus a credible alternative. Use randomized holdouts where feasible, staggered rollout when operations permit, or matched cohorts and before-and-after analysis with caveats. Report sample size, missingness, contamination, and confidence rather than a single percentage.
Useful formulas include accepted-signal rate = accepted ÷ reviewed; activation rate = acted-on ÷ accepted; opportunity rate = qualified opportunities ÷ activated accounts; and defined service remainder = (client fee minus stated service costs) divided by client fee. The metric dictionary must specify which records qualify.
Set cadence and thresholds in advance
A formal QBR is useful when enough actions and outcomes have accumulated to change a strategic decision. Monthly reporting may be better for a short sales cycle or high-volume activation. A semiannual review may fit low-volume enterprise motions. Do not force a quarterly calendar when the buying cycle or data lag makes it meaningless.
Invite only people who supply evidence or make decisions: executive sponsor, business owner, agency account lead, RevOps or data owner, relevant channel owners, and finance or sales leadership when commercial outcomes are discussed. Send specialist detail in the pre-read rather than filling the meeting with status updates.
Define thresholds before seeing results where possible. Include minimum adoption, acceptable quality, service-level performance, guardrail risk, and economic range. A client may renew a workflow with inconclusive pipeline evidence if adoption is strong and a longer window is justified; it may stop a workflow with many signals if nobody can act.
When sample size is insufficient, make a bounded decision: continue the test unchanged, broaden the eligible cohort, change the measurement method, or stop. Do not convert “not enough data” into a favorable claim.
Trace evidence through actual outcomes
Use stable IDs and timestamps to connect source evidence, identity result, fit result, suppression, acceptance, action, response, opportunity, and outcome. Preserve confidence and the reason for every rejection. This provides a traceable chain without implying certainty.
Differentiate account-level intent from person-level identity. A company’s topic research does not prove that a particular employee performed it. A resolved visitor may still be wrong. An enriched contact may be valid but unrelated to the active buying group. Use the weakest responsible claim that the evidence supports.
BrandWell MarketPulse is topic-based intent-data software for businesses and agencies. Choose relevant research topics, apply saved ideal-customer-profile filters, review available names, roles, companies and contact details, and export the audience or prepare a connected workflow. Plans start at $500/mo. TrafficID identifies visitors to your own website and is a separate product. A MarketPulse subscription does not by itself promise a white-label portal, custom API implementation, exclusive topics, or managed client delivery.
When outcomes cannot join cleanly, show a reconciliation queue. Common causes include duplicate accounts, CRM merges, missing campaign IDs, manual opportunity creation, and inconsistent dates. Fixing the data path may be the most important next-quarter decision.
Preserve exclusions and uncertainty
Selection bias appears when the best accounts receive the most attention. Contamination appears when comparison accounts see the same campaign. Survivorship bias drops closed-lost or deleted records. Cherry-picking highlights a few wins without the denominator. Prevent these problems with frozen cohorts, complete exports, documented exclusions, and independent QA.
Verify the actual source, recipient, purpose, jurisdiction, channel, destination and permitted use. Preserve ownership of necessary fields, access, retention, correction, deletion, suppression and incidents. A research topic, match or contact field does not establish permission; resolve unanswered requirements before execution.
Keep claims proportional. Do not guarantee a buyer, identity, meeting, pipeline, revenue, compliance outcome, ranking, or AI citation. Separate model inference from observed action and observed action from incremental effect. Explain material missing data.
Require human approval before outreach, changes to ad spend, CRM overwrites, or public material. Maintain least-privilege access, an audit log, rollback, and an incident owner. A QBR should expose risk and uncertainty, not edit them out for a renewal slide.
Record renewal, repair or stop conditions
Renew when the client uses the workflow, quality and service levels meet the agreement, economics remain acceptable, and the evidence justifies more learning or continued operation. Expand when the mechanism is credible, capacity exists, and the added segment or module has a distinct hypothesis.
Change when a specific bottleneck is visible: topics are broad, fit filters are weak, identity confidence is insufficient, the channel action is slow, or outcome feedback is missing. Stop when the client cannot act, permitted use is uncertain, cost exceeds decision value, or repeated evidence fails the pre-agreed guardrail.
Review an available MarketPulse topic, saved ICP and actual preceding-24-hour matches for the approved research purpose. Keep uncertain company context visible. AIMEE can organize supplied context through configured tools; named owners approve actual exports, messages, audience uploads and CRM writes.
Copyable QBR decision record
Decision: [Renew, expand, repair, continue a bounded test or stop.] Cohort: [Unique unit, dates, maturity, exclusions and baseline.] Evidence: [Inputs, accepted work, approved actions and buyer-confirmed outcomes.] Missingness: [Unknown outcomes, joins, late arrivals and denominator.] Costs: [Subscription, implementation, labor, exceptions and excluded expenses.] Comparison: [Actual alternative, changed conditions and causal limits.] Owner: [Action, deadline, feedback and next decision rule.]
Plan evaluation before the renewal meeting
HM Treasury’s Magenta Book guidance calls for evaluation to be built into intervention design and delivery from the earliest stages. Its scope is government evaluation, not an agency renewal benchmark. Applied here, agree on measurement and the decision before the results are known, rather than changing success criteria to support an expansion pitch.
Do not silently drop unknown outcomes
A fictional 100-account cohort has 60 reviewed accounts, 40 accepted briefs and 30 acted-on accounts. Feedback covers 24 acted-on accounts; six remain unknown. Four confirmed opportunities are 16.7% of accounts with feedback, 13.3% of acted-on accounts or 4% of the original cohort. Acceptance is 66.7% of reviewed accounts. Name each denominator; the six unknowns are neither confirmed failures nor successes. These invented figures are not BrandWell results.
Compare cohorts at the same outcome age
Suppose a fictional January cohort has been followed for 90 days and a March cohort for 30 days. Eight opportunities in January versus three in March does not establish a weaker March workflow. Report a common 30-day outcome view where data permits, then retain later January outcomes separately. Preserve cohort membership, changes in follow-up and remaining uncertainty. A same-age comparison still does not remove selection bias or prove causation.
Keep influenced pipeline separate from incremental value
In a fictional review, $200,000 of open pipeline includes accounts appearing in topic research. Only $50,000 meets the team’s written influenced-opportunity rule, and $10,000 is closed revenue. Those are distinct observed measures; none automatically represents incremental revenue caused by the subscription. A forecast from open pipeline is not collected revenue or contribution profit. Preserve the specific evidence and attribution rule for each opportunity.
Reconcile the renewal economics
A fictional $2,500 service fee covers a $500 standard Growth subscription, $400 setup, $600 delivery/review and $300 support, totaling $1,800. The defined remainder is $700, or 28% of the fee. Another $800 in correction work makes it negative $100. Acquisition, general overhead, tax and financing are excluded. The example is not a BrandWell agency-service price, typical margin or financial-return guarantee. A renewal decision should include actual capacity, client effort and unresolved obligations as well as this cost view.
Review the actual input inside MarketPulse
Open an available topic, apply the saved ICP and inspect actual preceding-24-hour matches and variable contact fields. Preserve the topic and filter version, approved research purpose and review disposition in the working record. AIMEE can organize supplied context through configured tools. Owners approve exports, messages, audience uploads and CRM changes. Custom QBR dashboards, client interfaces and synchronization need separately verified implementation, permissions, scope and fees.
Frequently asked QBR questions
Should every QBR end in expansion?
No. Record renewal, repair, a bounded continuation or stopping when the evidence supports it.
Are unknown outcomes failures?
No. Show them separately and report feedback coverage.
Can a 30-day cohort be compared directly with a 90-day cohort?
Not as equivalent outcome windows. Reconcile maturity and remaining differences.
Is influenced pipeline incremental revenue?
No. Keep attribution, collected revenue, profit and causal effects distinct.
Review the research product: explore MarketPulse and current plans.
Reviewed and updated October 3, 2026.

Written by