On this page
- Who this is for
- One-page decision summary
- Copyable client report template
- Label the evidence
- Define each metric
- Data and ownership
- Cost and evidence gaps
- A worked reporting example
- Common reporting risks
- Use the report for the next decision
- Bring MarketPulse findings into the report
- A fictional cost and decision note
- Client reporting questions
An agency buyer-intent report should explain what was observed, what the agency did, what happened next and what the evidence supports. Lead with the client’s decision, qualified outcomes, full cost and next test, rather than the largest possible count of “in-market” records.
Keep signals, matched records, activation, attributed outcomes and estimated incremental effects separate. State the actual observation and matching limits for each source. This template is a proposed reporting workflow, not a native automated BrandWell report or a guarantee of results.
Who this is for
This template is for agency owners, CEOs, CFOs, CROs, VP Marketing, and RevOps leaders who need a repeatable client-facing buyer intent report for monthly reviews, QBRs, renewals, or expansion decisions. It works best when the client has stable CRM definitions, meaningful outcomes, documented costs, and enough data for comparison. It is still useful at low volume, but the report must say when the available evidence cannot support an ROI or causal conclusion.
One-page decision summary
Open with a short narrative that answers seven questions:
- What decision is due? Continue, change, expand, pause, or run another test.
- What was the hypothesis? Name the segment, signal, action, expected outcome, and evaluation window.
- What was the baseline or counterfactual? Prior period, fit-only cohort, matched comparison, or randomized holdout.
- What did the agency deliver? Topics, signals, reports, audiences, workflows, campaigns, and SLA.
- What happened? Give absolute counts and rates from usable signal through qualified opportunity.
- How strong is the evidence? Descriptive, associational, attributed, or experimental.
- What should happen next? Name the change, owner, budget, deadline in the private operating plan, and stop/scale rule.
A defensible summary might say: “The program delivered the contracted topic coverage and activated two qualified cohorts. Opportunity rate was higher among exposed accounts than the fit-only comparison, but account selection and overlapping campaigns prevent a causal conclusion. Continue for one controlled cycle with stable creative and a clean holdout; do not expand budget until the predeclared qualified-opportunity threshold is met.”
That statement is more useful than “intent influenced $2 million in pipeline” without a definition.
Copyable client report template
1. Objective, scope, and baseline
- Business decision the report must inform
- Client ICP, markets, topics, exclusions, and included products
- Hypothesis and minimum useful effect
- Observation, activation, and outcome windows
- Baseline/counterfactual and why it is credible
- Source systems, owners, and known missing data
2. Signal delivery
- Unique accounts and signals by topic, source, segment, and week
- First seen, last seen, repeat observation, threshold, and freshness
- Account-level versus person-level status
- Contracted versus delivered coverage and SLA
- Suppressed, invalid, duplicate, stale, or unresolvable records
3. Identity and data quality
- Company-resolution and contact-coverage rates
- Records passing ICP, recency, permission, and suppression
- Duplicate, missing, conflicting, and false-match rates from QA
- Match-ready audience records and platform match where available
- Data provenance, permitted use, retention, and deletion status
4. Activation and service operations
- Audiences, CRM tasks, outbound actions, reports, or alerts created
- Records delivered, accepted, rejected, failed, or awaiting approval
- Time from observation to qualified action
- Media, model, enrichment, analyst, and service costs
- Human approvals, material edits, policy blocks, and incidents
5. Engagement and qualified outcomes
- Reach, frequency, response, site engagement, and conversion events
- Qualified replies, meetings held, and sales-accepted accounts
- Opportunities, stage changes, wins, revenue, and gross profit
- Sourced and influenced outcomes under separately defined rules
- CRM join and unattributed shares
6. Attribution and incrementality
- Attribution model, touchpoints, click/view window, and lookback
- Comparison-group construction and selection differences
- Experiment assignment, sample, contamination, exclusions, and analysis
- Absolute and relative lift with uncertainty
- Conditions that limit generalization
7. Decision, next test, and owner
- Continue/change/expand/pause recommendation
- Evidence supporting and opposing the recommendation
- Segment, topic, creative, workflow, or measurement change
- Budget and owner
- Success, stop, and escalation conditions
Label the evidence
- Descriptive: Reports what was observed or delivered, without proving buyer qualification or causation.
- Associational: Compares defined groups, with possible selection differences.
- Attributed: Assigns outcome credit under a stated rule, without proving the touch caused it.
- Experimental: A valid comparison can estimate an incremental effect for the tested population, with uncertainty and design limitations.
LinkedIn’s Revenue Attribution Report connects supported CRM data to ad activity and offers impression-based or engagement-based models with configurable touch counts and lookback. Record the actual model used. An attribution report assigns credit under its rules; a separate experiment is needed to estimate incrementality.
Define each metric
Every metric needs a definition, numerator, denominator, source, owner, inclusion rules, window, lag, and caveat.
Signal and quality KPIs
- Unique signaled accounts, signals per account, topic distribution, repeat rate, and observation freshness
- ICP pass, suppression, identity coverage, complete-record, duplicate, and false-match rates
- Usable signal rate:
records passing fit + identity + freshness + permission ÷ returned records - Platform audience match and reachable size, where relevant
Activation and operations KPIs
- Records delivered, approved, activated, rejected, failed, or expired
- Time from observation to action and percent inside SLA
- Human approval/edit rate, policy blocks, tool errors, and rollback
- Media, data, model, enrichment, analyst, and service spend
Outcome and economic KPIs
- Qualified response and held-meeting rate per usable signal
- Sales-accepted account and opportunity rate
- Sourced pipeline, influenced pipeline, and experimental lift as separate fields
- Cost per usable signal, meeting, opportunity, and incremental outcome
- Won gross profit and program margin, with all included costs disclosed
Do not use “ROI” without defining return, total cost, time horizon, and attribution/incrementality basis. A large pipeline numerator paired with only a software-license denominator is not a complete calculation.
Data and ownership
Assign an owner to each layer: agency strategist for the decision, data/RevOps for definitions and joins, media/outbound owner for activation, sales for disposition, finance for cost/value, privacy/security for governance, and an executive for the go/no-go decision.
Freeze the metric dictionary and comparison plan before the period. Snapshot the cohorts. Preserve observed-at, processed-at, activated-at, and outcome-at timestamps. Deduplicate accounts, contacts, opportunities, and touchpoints. Record changes to topics, creative, budget, scoring, attribution, and CRM stages. A report cannot explain a moving system when no one logs the movement.
Cost and evidence gaps
Budget platform/data, enrichment, CRM/warehouse work, media, model/tool use, analyst time, sales disposition, experiment opportunity cost, security/privacy review, report production, and client explanation. Add the cost of correcting false matches or misleading conclusions.
The report is decision-useful when definitions are stable, the client can observe a meaningful downstream event, data joins are adequate, and the comparison is credible enough for the size of the decision. It is insufficient when only signal counts exist, cohorts overlap heavily, the period is too short, CRM joins are missing, sample sizes are tiny, or concurrent changes explain the difference.
When evidence is weak, the right output is not “no value.” It is a narrower decision: validate coverage, fix instrumentation, extend the window, reduce the number of topics, or run a controlled test. State what cannot yet be concluded.
A worked reporting example
Fictional example: an agency receives 1,200 account-topic observations for a client. Those are not 1,200 leads. After deduplicating repeat observations, 740 unique accounts remain. The ICP and geography rules retain 410. Customer, competitor, active-opportunity, and suppression checks remove 65. Identity and minimum-data requirements leave 260 usable accounts. The activation platform matches 190, and 150 receive meaningful delivery.
The client report should show that whole waterfall:
- 1,200 raw observations;
- 740 unique observed accounts;
- 410 accounts passing ICP/geography;
- 345 after relationship and suppression rules;
- 260 usable identities;
- 190 platform matches;
- 150 delivered accounts.
In the same fictional example, eight of 150delivered accounts become qualified opportunities, compared with three of 150accounts in a fit-only comparison:5.33%versus2%, a 3.33 percentage-point difference. Before interpreting it, check how the cohorts were selected, sales effort, creative, other exposures and outcome definitions. The arithmetic does not establish that intent caused the difference.
Report the absolute opportunity rates, account mix, sales-response time, overlap, missing CRM joins, and cost. If assignment was not randomized, label the comparison observational. Recommend the next design needed to reduce uncertainty. If a later clean test estimates incremental opportunities, then calculate cost per incremental opportunity with the complete program cost.
This waterfall also makes optimization actionable. If most loss occurs at ICP qualification, change topics or market scope. If identity is the bottleneck, test enrichment. If platform match is weak, inspect identifiers and destination rules. If delivery is healthy but qualified outcomes are weak, change the offer, creative, or signal threshold. A single “influenced pipeline” number cannot diagnose any of those failures.
Common reporting risks
Selection bias occurs when high-intent accounts were already more likely to buy. Attribution bias occurs when a lookback awards credit to a touch that did not change behavior. Contamination occurs when control accounts see another campaign or sales action. Survivorship appears when only matched or active accounts remain in the analysis. Reporting bias appears when the agency highlights wins and hides invalid records or failed tests.
Client reports should also minimize personal data, separate clients, restrict roles, document exports, apply retention/deletion, and avoid sensitive or surveillance-like detail. Show the commercial evidence needed for the decision, not every underlying identifier.
Use the report for the next decision
Use a monthly operating report for delivery, quality, activation, and early outcomes. Use the QBR to decide topics, segments, channels, budget, workflow changes, and whether the evidence justifies renewal or expansion. Keep a change log so the next report can distinguish learning from noise.
Renewal should consider contracted versus delivered scope, signal relevance, usable-data trend, activation reliability, qualified outcomes, total cost, governance, agency learning, and next-test potential. A scoped MarketPulse evaluation can qualify the opportunity. Continued investment should be earned by a longer evidence plan.
A useful report makes the client’s decision easy to audit. Show the observations, actions, outcomes, limits of the evidence and the smallest next action that would reduce uncertainty.
Archive the metric dictionary, cohort snapshot, source exports, calculations, approvals, and final report together. That evidence trail lets a new client stakeholder reproduce the decision and prevents future QBRs from quietly changing the definition of success.
Review the current MarketPulse demo, plans and guarantee terms before a scoped evaluation. A short evaluation can assess audience fit, available fields and the workflow, but cannot establish future pipeline or revenue.
Add a sign-off line in the internal workflow for data/RevOps, the activation owner, and the client decision-maker. Each should confirm different facts: the numbers reconcile to source systems, the actions and costs are complete, and the recommendation follows the agreed decision rule. That small control helps prevent a polished narrative from outrunning the underlying evidence.
Keep rejected interpretations in the appendix so later reviewers can see which conclusions the evidence did not support.
Bring MarketPulse findings into the report
Use MarketPulse for relevant topic-based intent research. Standard plans are starting at $500/mo: Starter includes one topic with weekly pulls, Growth includes three topics with daily pulls, and Scale includes ten topics with daily pulls. Fields and audience size vary, and audiences can overlap.
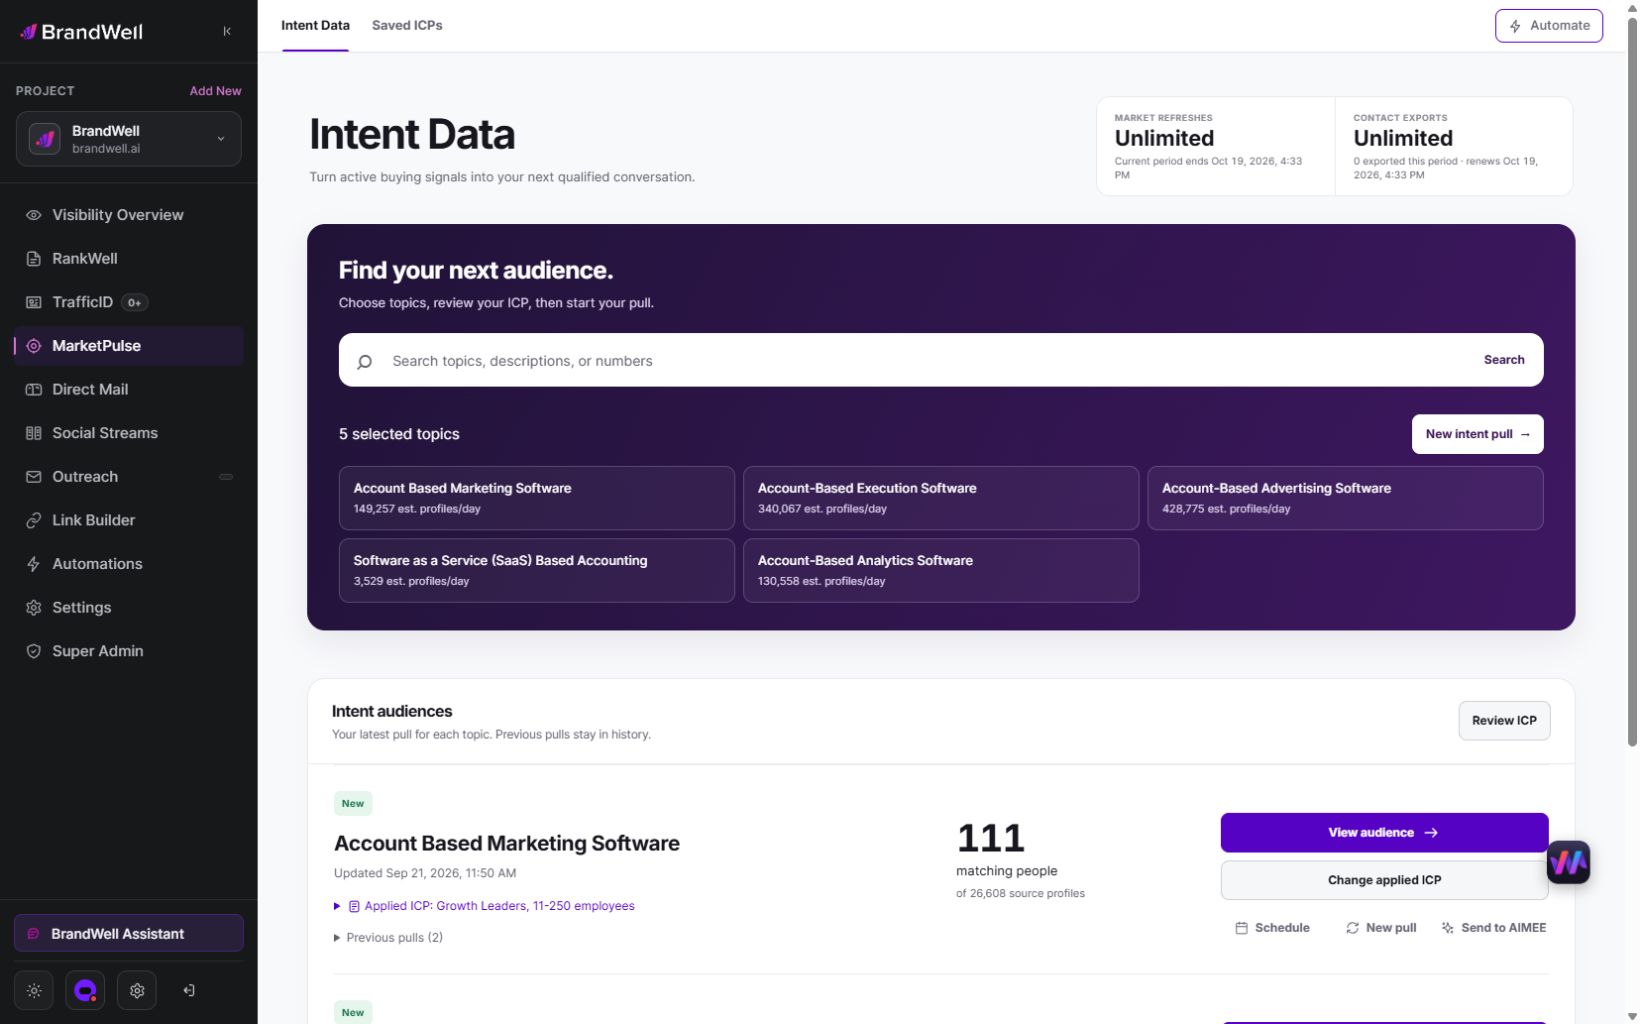
Keep topic, date, filters, available findings, review and subsequent actions in the reporting record. Join downstream outcomes using the client’s defined system of record. MarketPulse does not establish causal attribution or automatically verify a client’s revenue.
AIMEE can help prepare research and connected tasks according to configured access and tools. Have the responsible owner reconcile numbers, sources and costs before sharing the report. A proposed client service does not establish white-label or resale rights.
A fictional cost and decision note
If the fictional reporting period above costs $500 for data, $600 for analyst work and $900 for activation, full cost is $2,000. Dividing by 260 usable accounts gives $7.69 per usable account. Dividing by eight observed opportunities gives $250 per opportunity. Neither is customer acquisition cost or proof of incremental revenue.
A suitable recommendation could be: “Continue a bounded comparison with stable eligibility and creative. Fix missing CRM joins before expanding the budget. Review qualified opportunity rate and operating cost after the predefined outcome window.” Record evidence that argues against expansion as well as evidence that supports it.
Client reporting questions
Should every report include ROI?
Only when the return, full cost, window and basis are adequately defined. Otherwise report the narrower outcomes available and what is still missing.
Are topic observations the same as leads?
No. Preserve the original observation unit and the steps needed to qualify, identify and activate a usable record.
What if the sample is small?
Report the counts and limitations. Focus on coverage, instrumentation or a stronger next test rather than forcing a positive revenue conclusion.
What should the client approve?
The client decision-maker should review the recommendation and scope; data and activation owners should separately verify definitions, actions and costs.
Review MarketPulse’s current plans and demo or explore the BrandWell product directory to scope the research component.
Reviewed and updated October 3, 2026.

Written by