


On this page
- 1. Choose comparable pages and a customer task
- 2. Separate public observations from private metrics
- 3. Build an original benchmarking worksheet
- 4. Compare speed under documented conditions
- 5. Use your own search data to prioritize
- Turn the findings into work in BrandWell
- How often should you benchmark?
- Common questions
Benchmark your website by comparing observable page experiences and search visibility, then measuring improvements against your own business baseline. You can inspect a public site’s navigation, content and performance. You cannot infer its private GA4 conversion rate, revenue or customer quality from its design or estimated traffic.
A useful benchmark produces a prioritized change, an owner and a measurement plan. It does not require copying another company’s article or assuming that a popular page is profitable.
1. Choose comparable pages and a customer task
Pick businesses serving a similar audience, region and need. Compare equivalent page types: a service page with a service page, a pricing page with a pricing page. A large publisher’s homepage is usually a poor baseline for a local company’s consultation page.
Define the task first. For example: can an office manager understand a backup-testing service, find its scope and request a consultation? This is more actionable than asking whether another site looks “better.”
2. Separate public observations from private metrics
- Public observations: visible content, navigation, forms, stated offers, mobile behavior and reproducible performance tests.
- Your own measured data: Search Console impressions and clicks, analytics sessions, configured key events and approved sales outcomes.
- Estimates: modeled traffic or visibility figures, which need a documented source and method and should not be treated as another company’s analytics.
- Unknowns: competitor revenue, profit, conversion rate and lead quality unless the company publishes suitable evidence.
Do not compare your measured bounce rate with an unexplained external estimate as if they used the same definition or collection method. Use comparable evidence or mark the item unknown.
3. Build an original benchmarking worksheet
For each page, record its URL, page type, date, device, customer task and observation. Then capture a proposed response for your site:
- Clarity: does the hero explain the service and audience?
- Evidence: does the page show a real method, demonstration or relevant example?
- Navigation: can a visitor find scope, pricing information and the next step?
- Mobile usability: do forms, menus and tables work without page overflow?
- Performance: which repeatable diagnostic points to an actionable loading issue?
- Measurement: what will you inspect on your own site after the change?
Planning example: your backup-service page says “complete protection,” but does not explain what a restore test includes. The action is to replace the broad promise with verified scope and a sample test record. The measure is qualified consultation requests from that page, with the period and source filters recorded. This is an original hypothetical exercise, not a competitor case study.
4. Compare speed under documented conditions
Use Lighthouse for reproducible diagnostic checks and record the device simulation, URL and test conditions. Repeat a surprising result before making it the basis for a large change. One lab run does not represent every visitor.
Core Web Vitals describe loading, interaction and visual stability. The good thresholds are LCP at or below 2.5 seconds, INP at or below 200 milliseconds and CLS at or below 0.1, assessed at the 75th percentile with mobile and desktop considered separately. A lab score is not a substitute for field data, and an ordinary Lighthouse page-load test does not measure real-user INP.
If field data is unavailable, label it unavailable. Do not interpret an empty report as a pass. Focus first on problems you can reproduce, such as an oversized hero image, delayed rendering or a form that shifts during loading.
5. Use your own search data to prioritize
Review Search Console performance by page and relevant query. Keep date range, device, country and search type consistent. High impressions and low CTR can suggest a title or intent mismatch, but position and query mix also affect the result.
Open the actual article before changing its title. If the page promises examples but only offers general advice, improve the answer as well as the search preview. Record the change and evaluate a later comparable period; a before-and-after difference alone does not prove causation.
Turn the findings into work in BrandWell
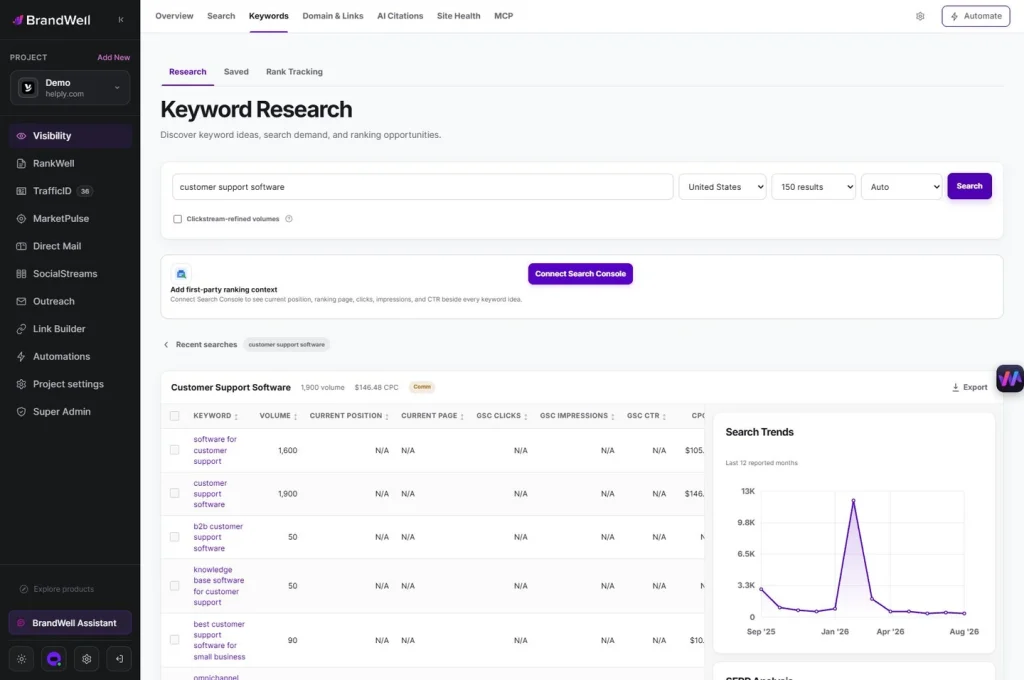
In the current BrandWell portal, use available Keyword Research in the Visibility workspace to investigate relevant questions and opportunities. Treat suggestions as inputs to review, not instructions to publish every keyword variation.
Use RankWell to prepare and review the article brief and draft. Supply original evidence, verify current product details and inspect the search preview. Publishing through your configured workflow does not guarantee rankings or conversions.
How often should you benchmark?
Choose a cadence your team can act on, and revisit after material changes such as a redesign, pricing update or new service. A monthly review of important pages and a broader quarterly check can be a planning starting point, not a universal requirement. Investigate broken journeys promptly rather than waiting for the scheduled review.
Common questions
Can I see a competitor’s conversion rate?
Usually not from public inspection. Keep it unknown unless reliable published evidence explains the metric and scope.
Should I copy a page that ranks?
No. Identify the customer question and evidence gap, then create your own useful answer and examples.
What should the final report contain?
A documented observation, proposed action, responsible owner, priority and a measurable outcome on your site. That is enough to turn benchmarking into a practical improvement cycle.
Reviewed and updated October 2, 2026.

Written by
Jeff Joyce has been helping brands grow online since the Myspace era, when custom HTML layouts were still a competitive advantage. What started in design quickly evolved into a career spanning social media, content strategy, video, agency ownership, and growth marketing. After building his own agency and testing countless AI tools, Jeff joined BrandWell with a clear focus: helping marketers understand how AI can actually improve the way they create, optimize, and scale content. Today, Jeff brings a CMO-level perspective to BrandWell's marketing strategy, blending brand positioning, content, video, customer education, and growth. His work centers on turning complex AI concepts into clear, practical marketing that helps brands move faster, create better content, and stay competitive without losing their voice.
 Farnaz Kia