On this page
- Who is this for?
- Nine steps for cohort analysis
- Build a reproducible cohort table
- Five methods and their limits
- Tools and review records
- What does cohort analysis cost?
- How should results be reported?
- Five failure modes
- Handoff checklist
- A worked example with clear denominators
- Use BrandWell findings as an input
- Common cohort-analysis questions
Run cohort analysis by defining eligibility, an entry event, a common observation window and a measurable outcome before comparing groups. Decide whether the work describes a pattern or tests an incremental effect. A group that converts more often is not automatically evidence that intent activation caused the difference.
This framework covers nine setup steps, five analysis methods, operating records, costs and failure modes. Use the actual source’s observation and matching limits rather than assuming every intent or identity signal behaves the same way.
Who is this for?
This framework is for CEOs, CFOs, CROs, VP Marketing, RevOps, analytics teams, and agencies deciding whether an intent program changes qualified pipeline, efficiency, velocity, or retention. It is useful when the team can define stable events, join exposure to outcomes, and maintain a credible comparison.
It is not decision-ready when cohort membership changes after seeing the result, exposure is unknown, CRM outcomes are inconsistent, groups are tiny or incomparable, or concurrent campaigns reach both groups. In those cases, report a descriptive pattern, improve the data, or design a stronger test rather than manufacturing certainty.
Nine steps for cohort analysis
1. Write the business decision
State the action the analysis could change: continue the program, adjust topics, change activation, shift budget, narrow the ICP, or run a stronger experiment. Name the decision owner and the minimum evidence required.
Choose one primary question. “Does intent data work?” is not testable. “Does activating fresh, ICP-qualified account signals increase accepted opportunities relative to comparable eligible accounts not activated during the same window?” is much closer.
2. Define eligibility and the analysis unit
Specify the population before assigning cohorts. Include ICP rules, geography, company size, existing customer or opportunity state, data availability, minimum history, and exclusions. Choose account, person, opportunity, or campaign as the analysis unit and explain why.
Do not mix units in the denominator. If activation happens at the account level but outcomes are counted by contact, an account with many contacts can dominate the result.
3. Lock the cohort-entry event and index time
Define the event that assigns membership: first qualifying topic surge, first accepted site-visitor match, first activation, or another precise event. Record whether an entity can enter once or repeatedly and how ties, time zones, late-arriving events, and backfills are handled.
GA4 cohort exploration uses inclusion and return criteria with daily, weekly or monthly grouping. Its cohorts use device data and do not consider User-ID. Treat it as a web-analytics tool, not a substitute for an account-level CRM cohort.
4. Choose the comparison or counterfactual
The comparison should represent what would likely have happened without the activation. A randomized eligible-account holdout is the strongest practical option when randomization, compliance, and volume are adequate.
If randomization is unavailable, consider a pre-period baseline, matched eligible accounts, geographic or team rollout, interrupted time series, or a model-based counterfactual. Record why the comparison is credible and what unobserved differences could remain.
5. Set observation and maturation windows
Define the lookback used for balance and baseline, the cohort-entry window, activation window, outcome window, and maturation delay. Account for the sales cycle without choosing a window after seeing which one produces a favorable result.
Specify how overlapping treatments, repeated signals, late CRM updates, reopened opportunities, and renewals are handled. Freeze these rules in a pre-analysis plan.
6. Choose one primary outcome and several guardrails
The primary outcome should match the decision: accepted opportunities, qualified pipeline, revenue when mature, cost per accepted opportunity, or time to a qualified stage. Define it using stable CRM fields and ownership.
Guardrails catch harmful tradeoffs. Track eligible reach, match rate, false or disputed matches, sales rejection, opt-outs, complaints, frequency, missing outcomes, and total cost. A program that creates more meetings but lower acceptance may not be an improvement.
7. Predefine exclusions and contamination rules
List customers, open opportunities, disqualified accounts, employees, test records, missing identifiers, concurrent campaigns, and accounts that cross from control to treatment. Decide whether each case remains, is excluded, or is analyzed separately.
Avoid post-treatment exclusions. Removing accounts because they did not engage after activation selects on the outcome and can make the treatment group look better.
8. Analyze uncertainty and sensitivity
Report cohort sizes, denominators, pre-period balance, missingness, absolute and relative differences, and uncertainty. A confidence interval does not repair selection bias, exposure contamination, identity error or a missing comparison. Ask a qualified analyst to check the design and calculations.
Run sensitivity checks across reasonable entry definitions, matching choices, outcome windows, and missing-data treatments. If the conclusion changes with every specification, that instability is part of the result.
9. Write the decision memo and retest plan
Separate facts, estimates, assumptions, and recommendations. State what the analysis supports, what it does not support, which action is approved, and which guardrails trigger rollback.
Keep the query or code version, data dictionary, cohort specification, results, reviewer comments, and approval together. Define the next test before operational teams change the program in ways that make replication impossible.
Build a reproducible cohort table
At minimum, include:
- Stable analysis-unit ID and entity type.
- Eligibility state and the versioned rule that produced it.
- Cohort-entry event, source, index time, and repeated-entry rule.
- Intent topic, signal definition, specificity, recency, and expiry.
- Identity method, match confidence, conflicts, and correction state.
- Activation or exposure time, channel, campaign, message, and owner.
- Comparison assignment and crossover or contamination flag.
- Primary outcome, outcome time, CRM definition, and missingness state.
- Guardrails, exclusions, concurrent treatments, and data-quality flags.
- Transformation, query, model, and dataset version.
Separate account and person records. If several people map to one account, define deduplication and the outcome unit before analysis. Keep raw signals distinct from derived stage scores and activation decisions so the team can audit leakage and changes.
Five methods and their limits
1. Descriptive cohort trend
Compare return behavior or outcomes for cohorts defined by entry period, topic, recency, or activation. This is fast and useful for operations.
Permitted interpretation: “This is what happened to these defined groups.”
Limitation: It does not isolate the program effect.
2. Matched observational cohort
Match activated and non-activated eligible accounts on pre-treatment fit, history, region, size, prior engagement, and other relevant observed variables. Check balance before comparing outcomes.
Permitted interpretation: “Comparable groups on measured variables had different outcomes, subject to residual confounding.”
Limitation: Unobserved differences can still drive the result.
3. Randomized holdout
Randomly assign eligible units to activation or holdout before treatment. Monitor assignment, compliance, crossover, sample size, and outcome collection.
Permitted interpretation: With a valid design and analysis, differences can support an incremental-effect estimate for the tested population and intervention.
Limitation: Small samples, noncompliance, spillover, or broken randomization can still invalidate the conclusion.
4. Interrupted time series or counterfactual model
Model what the outcome would have been after an intervention using stable pre-period behavior and appropriate control series. The Bayesian structural time-series research behind CausalImpact describes one such counterfactual approach.
Permitted interpretation: A model-based effect estimate under stated assumptions.
Limitation: Concurrent changes, unstable relationships, or a poor control series can produce a misleading counterfactual.
5. Attribution report
Allocate opportunity or revenue credit using a defined rule or model. Attribution is useful for operations, channel reporting, and reconciliation.
Permitted interpretation: “Under this attribution rule, these touches received this credit.”
Limitation: Attribution is not the same as incrementality. It does not show what would have happened without the program.
Tools and review records
Choose tools after choosing the method:
- A spreadsheet or BI tool can support a small descriptive cohort with transparent formulas and careful QA.
- A warehouse and SQL or notebook workflow supports reproducible eligibility, joins, repeated analysis, and version control.
- A product or web analytics platform helps with event-based inclusion and return behavior when identity and event definitions fit the decision.
- An experiment platform manages assignment, exposure, guardrails, and repeated testing when randomization is available.
- A statistical environment supports matching, uncertainty, sensitivity, and counterfactual models under qualified analysis.
What does cohort analysis cost?
Budget for intent and identity data, warehouse or analytics tooling, experiment infrastructure, integrations, analyst or statistician time, CRM cleanup, quality assurance, privacy and security review, and decision-maker review. Include the opportunity cost of withholding activation from a holdout and the cost of delaying a decision while outcomes mature.
Separate one-time design and integration from recurring data, tooling, and reporting. Also model the cost of a wrong decision. A weak analysis that causes the team to scale ineffective outreach can cost more than a longer, well-designed test.
There is no universal sample-size, analyst-hour, or tool-cost benchmark. Use the expected outcome rate, minimum decision-relevant effect, acceptable uncertainty, design, contamination, and data readiness to create a scoped plan and obtain current quotes.
How should results be reported?
Every report should show eligibility, cohort assignment, exposure, sample size, denominators, pre-period balance, missingness, outcomes, absolute and relative differences, uncertainty, contamination, sensitivity checks, and the pre-agreed decision rule.
Label each sentence as descriptive, associative, model-based, or experimental in substance, even if those words do not appear every time. Avoid claims such as “intent generated this revenue” when the analysis only shows that high-intent accounts converted more often.
Five failure modes
1. Selecting on a future outcome
The cohort is defined using engagement or conversion that happened after activation, making the comparison circular.
2. Comparing high-intent accounts with the full database
The groups differ in fit and readiness before treatment, but the gap is called lift.
3. Ignoring exposure contamination
Holdout accounts receive the same ads, outreach, or sales attention through another route.
4. Leaking identity and outcomes across units
Person and account joins double count results, misattribute activity, or expose data beyond permitted use.
5. Publishing a causal claim from association
A descriptive pattern becomes a public revenue claim without a credible counterfactual or adequate substantiation.
Downgrade the claim or stop the analysis when the cohort is too small, groups are not comparable, exposure is unknown, outcome definitions changed, identity fails, or the conclusion is specification-dependent.
Handoff checklist
Before a decision, confirm:
- Business decision, accountable owner, primary question, and minimum evidence.
- Eligibility population, analysis unit, index event, and repeated-entry rule.
- Comparison or counterfactual with documented assumptions.
- Pre-period, activation, maturation, and outcome windows.
- Primary outcome, guardrails, stable CRM definition, and outcome owner.
- Exclusions, concurrent treatments, crossover, and contamination rules.
- Identity, provenance, missingness, and data-quality controls.
- Effect estimate, denominators, uncertainty, balance, and sensitivity checks.
- Descriptive, associative, model-based, or experimental claim label.
- Decision, approval, rollback, reproducible query or code, and retest plan.
A useful cohort analysis does not force a positive answer. It makes the next business decision more defensible and shows exactly what evidence would change it.
A worked example with clear denominators
Fictional example: A pilot assigns 200 eligible accounts to activation and 200 to holdout before treatment. Within the predefined outcome window, 24 activated accounts and 16 holdout accounts produce an accepted opportunity. The account-level rates are 12% and 8%, a difference of 4 percentage points and a 50% relative difference. These are illustrative figures, not a BrandWell result.
Thirty contacts at one account still count as one account under this definition. The arithmetic alone does not establish a reliable effect: review randomization, crossover, spillover, missing outcomes, uncertainty and the predefined analysis. Small event counts may leave a wide range of plausible effects.
Suppose the same fictional pilot costs $500 for data, $1,200 for analyst work and $300 for implementation: $2,000 total. Dividing by 24 observed opportunities gives $83.33 per observed opportunity. Dividing by the eight-opportunity point-estimate difference gives $250 per estimated additional opportunity, but only if the experimental interpretation is valid. Neither calculation is customer acquisition cost or ROAS.
Use BrandWell findings as an input
MarketPulse supports topic-based intent research. Standard plans are starting at $500/mo: Starter includes one topic with weekly pulls, Growth includes three topics with daily pulls, and Scale includes ten topics with daily pulls. Available audience size and fields vary; audiences can overlap.
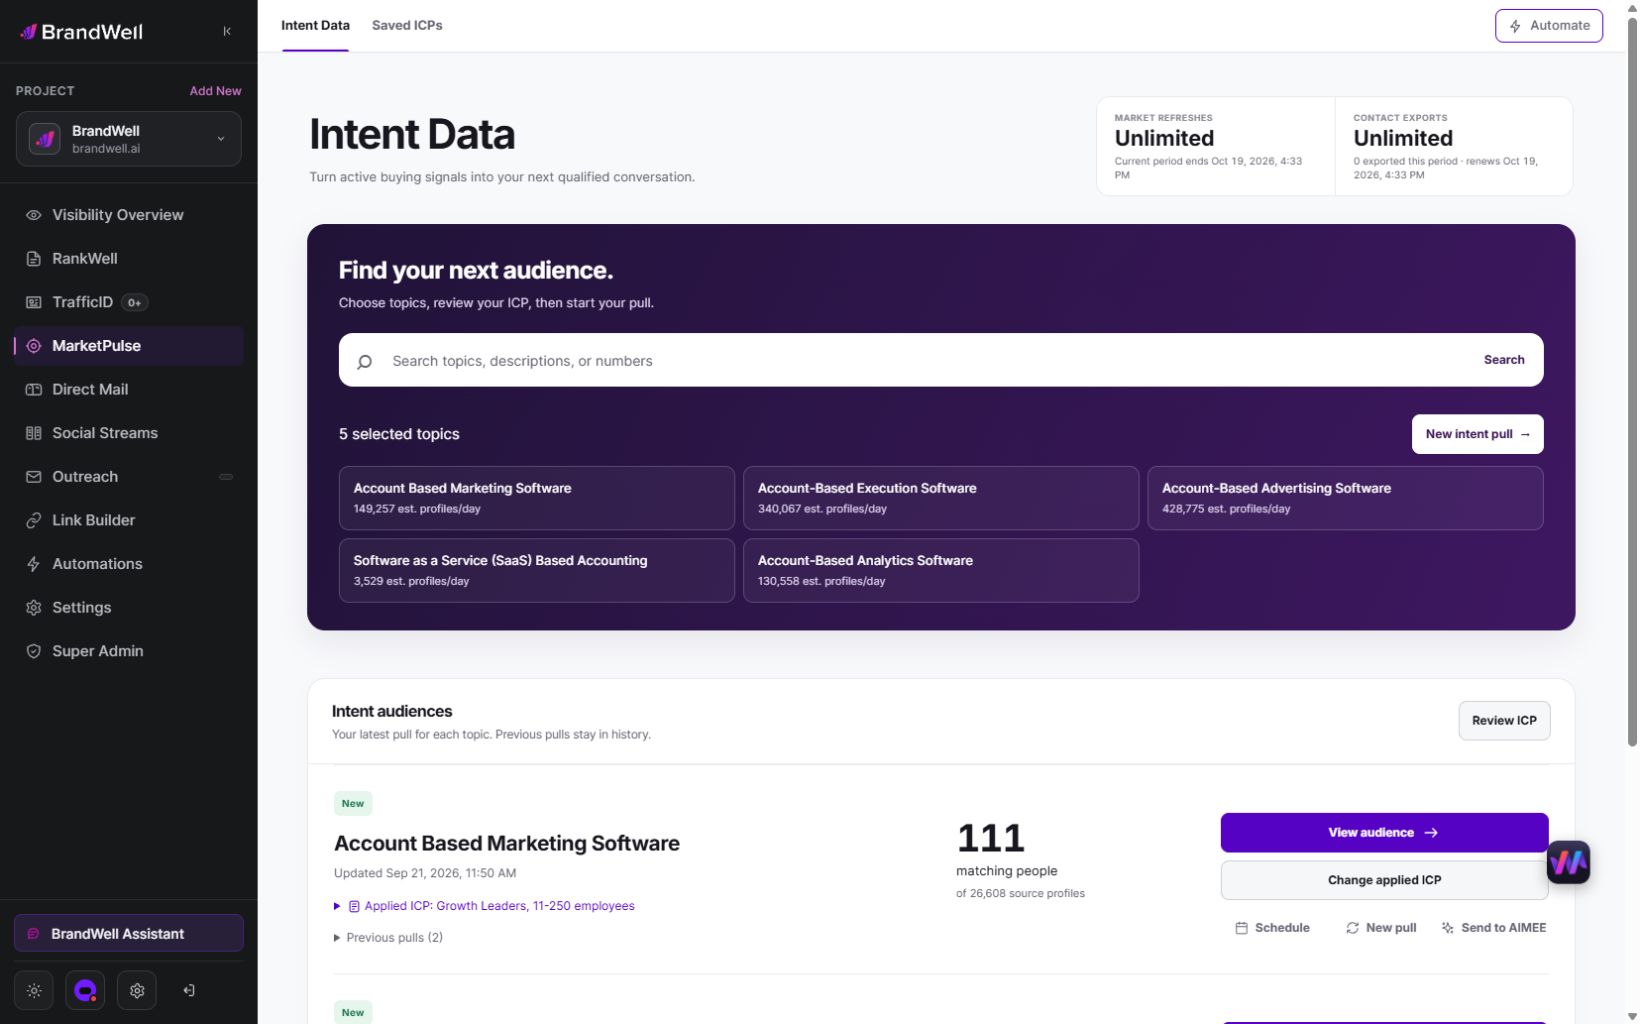
Record the relevant topic, observation time, filtering and activation as separate analysis inputs. MarketPulse does not replace a warehouse, CRM outcome definition, experiment platform or qualified statistical review. A subscription does not establish a causal effect or a native cohort-analysis integration.
AIMEE can help prepare research and connected workflow tasks according to configured access and tools. An agency can add its own scoped review and reporting service, with client-approved criteria and separate records. Confirm any external action and its destination.
Common cohort-analysis questions
Is a cohort report an experiment?
Not necessarily. A cohort is a defined group; the study design determines what its comparison can support.
Does attribution prove incremental revenue?
No. Attribution assigns credit under a rule, while incrementality asks what would have happened without the intervention.
Can I compare accounts and contacts directly?
Keep the unit consistent or explicitly model the relationship. Multiple contacts at one account can otherwise inflate counts.
How long should I observe outcomes?
Choose the window and maturation delay before reviewing results, based on the question and actual sales cycle. There is no universal duration.
Explore MarketPulse’s current plans and the BrandWell product directory to scope the research component of your test.
Reviewed and updated October 3, 2026.

Written by