On this page
- Current MarketPulse research workflow
- Check the actual source-comparison scope
- Choose a bounded investment decision
- Freeze costs, cohorts and definitions
- Use seven comparison operating assets
- Keep evidence methods distinct
- Count full costs and failed work
- Show metrics with their denominators
- Report insufficient comparison evidence
- Trace the actual signal-to-outcome chain
- Check selection and cost distortion
- Scope separate client comparison reporting
- Copyable source-economics comparison
- Frequently asked cost-per-opportunity questions
Calculate cost per opportunity by dividing defined source costs by unique accepted opportunities from a consistently defined, mature cohort. Show direct and shared costs, allocation rules, overlap, missingness and zero outcomes. The ratio can inform a bounded source test; it does not prove the source caused an opportunity.
Current MarketPulse offer: intent-data plans start at $500/mo. See the product, demo, and current plans. Updated October 3, 2026.
Current MarketPulse research workflow
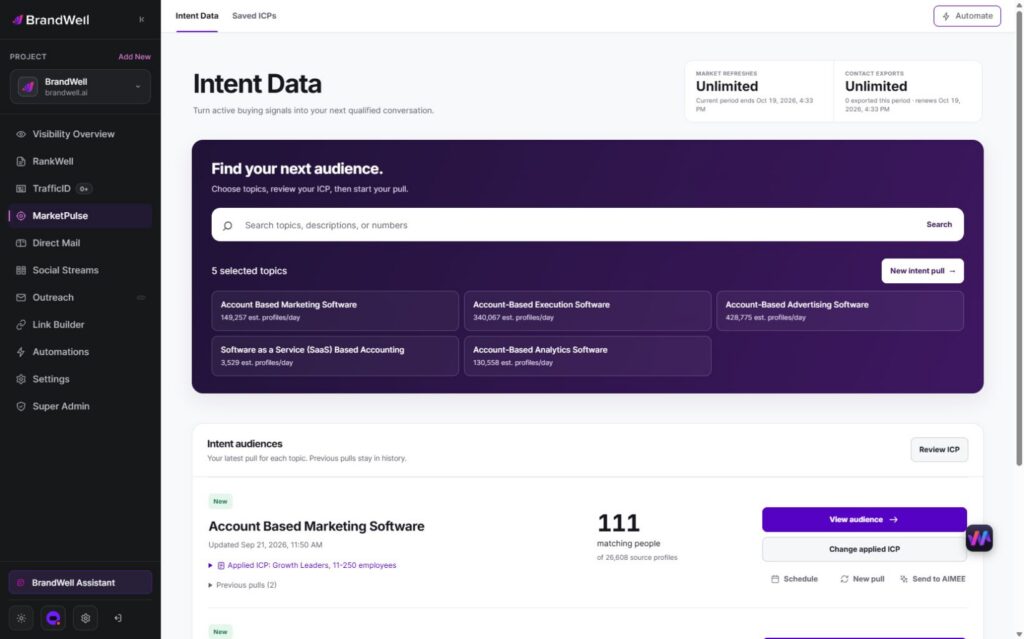
BrandWell MarketPulse: intent data starting at $500/mo. Find people researching topics relevant to what you sell, apply saved ICP filters, and review available contact details before taking action.
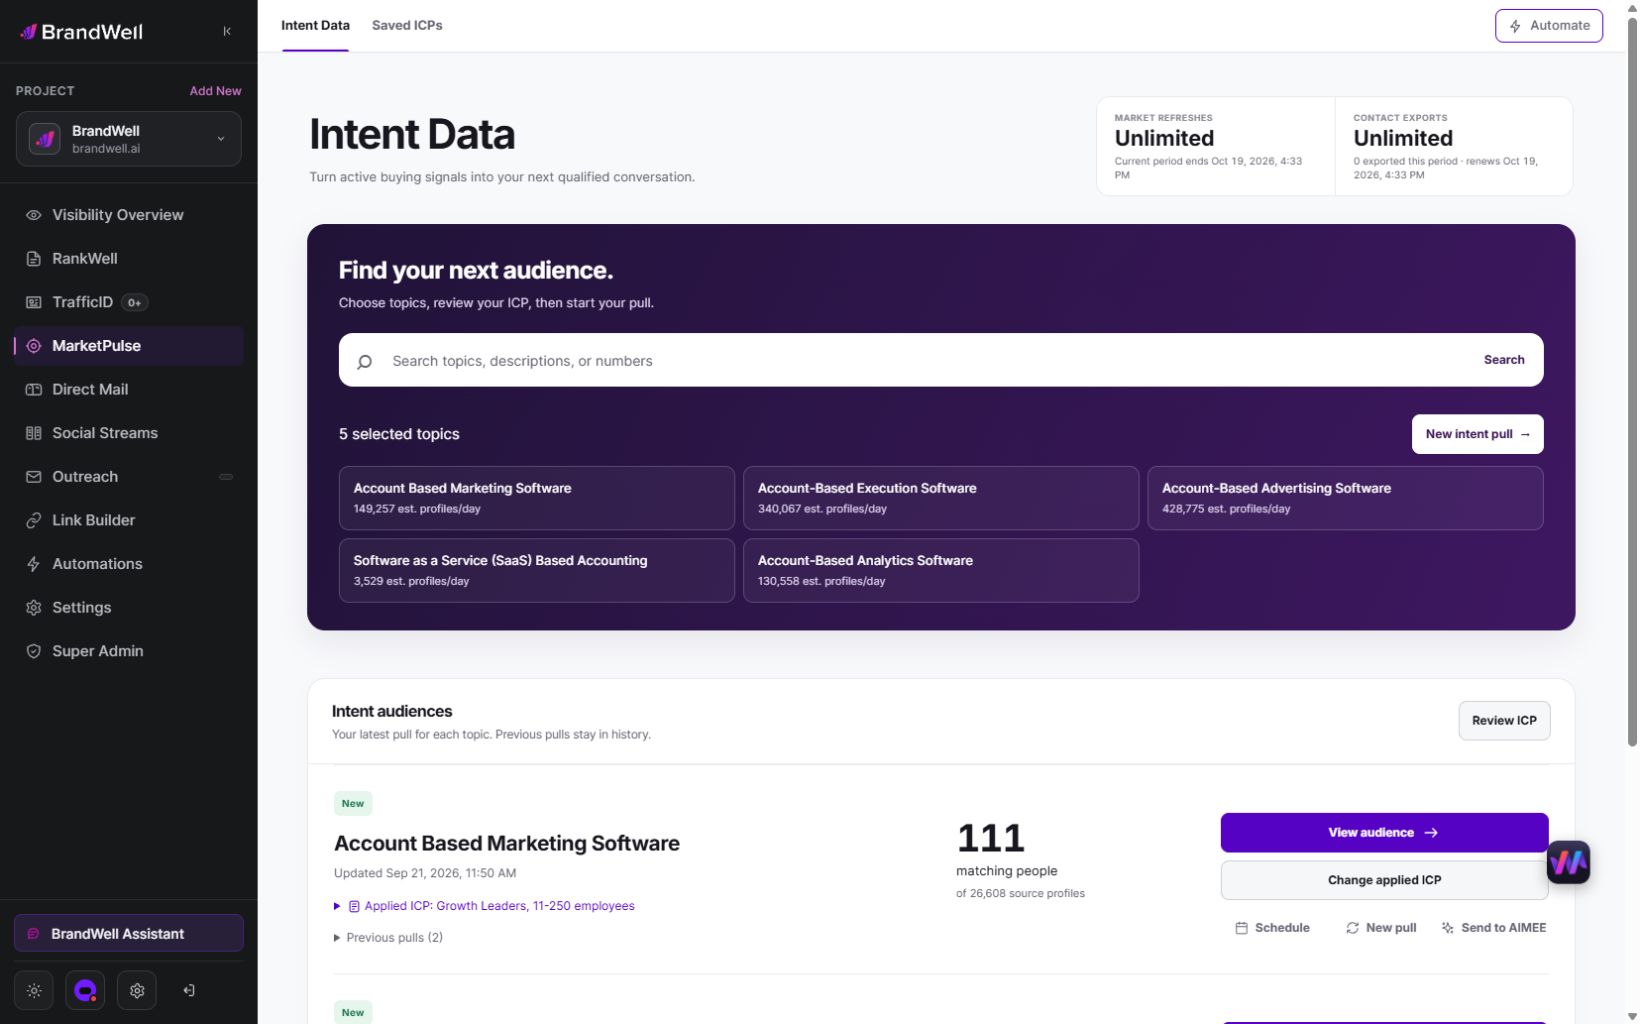
MarketPulse plans are starting at $500/mo. Verify current package scope and offers on the product page.
| Plan | Topics and refreshes | Monthly exports |
|---|---|---|
| Starter | 1 topic, weekly | 25,000 contacts |
| Growth | 3 topics, daily | 100,000 contacts |
| Scale | 10 topics, daily | Unlimited contacts |
Swipe the table to see all columns.
A pull retrieves available data from the previous 24 hours for one topic. Daily use across all included topics provides 90 Growth pulls or 300 Scale pulls in a 30-day month. Weekly Starter pulls vary by calendar month. Available audience size and contact fields vary, and audiences may overlap. Refreshes stop at the plan limit without overage charges.
- Find and qualify: search the topic catalog, save your ICP, and review the people and companies that match.
- Act on the research: export qualified contacts or prepare an Outreach or Direct Mail workflow. Connected products, channel usage, and fulfillment may cost extra.
- Get help from AIMEE: Growth and Scale include AIMEE for the initial user to research accounts and prepare the next step through connected tools.
Agencies and other service businesses can build client deliverables around their available Intent Scans and exports. Keep each client’s scope, permissions, and service fees clear. A subscription is not a promise of a white-label platform or exclusive access to a market.
Explore MarketPulse and watch the demo or compare plans starting at $500/mo. Any early-access discount is a separate, time-limited offer shown to an eligible recipient.
Check the actual source-comparison scope
This cost per opportunity by signal source implementation guide is for CEOs, CFOs, CROs, VP Marketing leaders, RevOps teams, demand generation analysts, and agencies comparing first-party engagement, off-site intent, visitor identification, events, referrals, paid media, or outbound signals. It assumes that sales acceptance is reliably recorded. It is not a broad campaign-attribution guide, a universal intent-data ROI benchmark, or a license to ignore privacy and data rights.
Choose a bounded investment decision
The metric should answer a narrow decision: Which signal source deserves another controlled unit of investment or operating attention under comparable conditions? It should not answer “Which source caused revenue?” unless the program used a credible causal design.
Start with a baseline or counterfactual. Depending on the decision, that may be the existing lead-source mix, an eligible holdout, a randomized treatment, or a matched historical cohort with clear limitations. Compare incremental source investment with the change in accepted-opportunity economics, coverage, quality, and risk. A low cost per opportunity can be misleading if the source captures demand that another channel created, reaches only an easy segment, or sends opportunities that rarely progress.
A useful decision hierarchy is:
- Keep measuring when counts are too small or outcomes are immature.
- Fix instrumentation when source, cost, or acceptance definitions are inconsistent.
- Test a bounded reallocation when economics differ and uncertainty is tolerable.
- Reduce or redesign when fully loaded cost remains weak after quality and mix checks.
- Scale cautiously when results persist in a new cohort without privacy or operational failures.
Freeze costs, cohorts and definitions
Freeze a data dictionary before calculation. Define an accepted opportunity as a record that meets documented qualification criteria and is accepted by the designated sales owner – rather than every CRM object labeled “opportunity.” Define the source cohort at the moment the record first becomes eligible for the evaluated workflow. Preserve subsequent touches separately so one opportunity is not counted in every source denominator.
For each source, capture direct data fees, media, enrichment, identity resolution, creative or content, tooling, integration, analyst and operations time, agency fees, and an allocation rule for shared costs. Then capture eligible records, activation date, opportunity acceptance date, value band, stage, exclusions, and maturity status. Use the same cohort duration and outcome-maturation rule across sources.
Assign a RevOps owner for definitions, finance owner for cost allocation, marketing owner for source operations, sales owner for acceptance quality, and privacy/security owners for data use. The workflow is: validate lineage, freeze the cohort, reconcile costs, deduplicate people and accounts, wait for the outcome window, calculate counts and rates, run mix and confidence checks, document caveats, and approve a bounded action.
Use seven comparison operating assets
1. Fully loaded source-cost waterfall
List every direct and allocated cost from acquisition through accepted-opportunity handoff. Show recurring, variable, and one-time costs separately. Limitation: shared-cost allocation is a management convention, not an observable fact, so provide a sensitivity range.
2. Accepted-opportunity definition card
Specify required fields, disqualifiers, owner, acceptance event, rejection reasons, and audit sample. Use the same card for every source. Limitation: a definition cannot prevent inconsistent sales behavior unless acceptance is monitored.
3. Source cohort ledger
Freeze entity, first eligible source, activation timestamp, comparison window, downstream touches, outcome, and maturity status. Limitation: first-source assignment simplifies a multi-touch journey and should not be mistaken for full attribution.
4. Cost-per-opportunity calculator
Calculate fully loaded cost divided by accepted opportunities and show the numerator and denominator next to the rate. Include zero-opportunity cohorts explicitly rather than hiding them. Limitation: the ratio is unstable at low counts and can change sharply after one opportunity.
5. Cohort and segment comparison
Compare by ICP tier, market, deal-size band, source age, identity-confidence band, and activation treatment – only where sample size supports interpretation. Limitation: repeated slicing increases the chance of finding a pattern that will not repeat.
6. Confidence and sensitivity worksheet
Show count thresholds, interval or uncertainty method, outcome maturity, missing cost, alternate allocations, and results with influential accounts removed. Limitation: no statistical technique repairs biased selection or a missing counterfactual.
7. Agent-ready evidence packet
AIMEE can prepare a review brief through configured connected tools. Keep proposed actions separate from actual approvals and destination acknowledgements. Confirm the implementation and permissions before execution.
Keep evidence methods distinct
A suitable randomized design can estimate the effect of the tested action among actual eligible units when assignment and outcome tracking are valid. It does not establish the inherent value of every signal. Document contamination, compliance, maturity, missingness and uncertainty.
Attribution assigns credit under a chosen model; it does not establish incremental opportunities or revenue. Keep attributed, observational and experimental findings labeled with actual method, population and limitations.
For a suitable comparison, specify actual eligible units, assignment, offer, outcome, observation window, stop rule and overlap checks. Keep inconclusive evidence visible rather than declaring a source winner.
Count full costs and failed work
A complete cost per opportunity by signal source cost model includes data licenses, topic or record usage, visitor-identification and enrichment charges, media, content and creative, integration, CRM and warehouse work, analyst time, sales-review time, agency delivery, privacy and security review, and maintenance. Opportunity cost also matters: a source can consume SDR attention, audience capacity, or analyst work even when its invoice is small.
Separate costs that create future reusable infrastructure from costs attributable only to the cohort. Amortize one-time implementation using a disclosed period, then rerun the model without amortization as a sensitivity view. Never bury failed tests or unactivated records outside the numerator.
Show metrics with their denominators
The core report should show fully loaded source cost, eligible entities, activated entities, accepted opportunities, cost per accepted opportunity, rejection reasons, opportunity value bands, outcome maturity, and evidence grade. Supporting metrics include match rate, contactability, time to acceptance, stage progression, and sales-capacity consumed. Keep volume and quality together: a low ratio based on two hand-selected accounts is not comparable with a source covering the entire market.
- Consistency check: one opportunity definition, cost method, and cohort window.
- Mix check: ICP, geography, company size, deal size, and campaign treatment.
- Maturity check: percentage of records with enough time to become opportunities.
- Influence check: result with the largest accounts removed.
- Missingness check: unmatched cost, unknown source, duplicate entities, and unrecorded rejection.
- Privacy check: lawful/policy review status, suppression, retention, and restricted topics.
Report rates with counts and ranges rather than a single decimal. Do not invent cost per opportunity by signal source benchmarks from unrelated companies. The most useful internal benchmark is a consistently measured baseline under similar conditions.
Report insufficient comparison evidence
The model is decision-useful when source cohorts are distinct, cost is reconcilable, opportunity acceptance is stable, enough outcomes have matured, and a practical next action exists. It is especially useful for choosing which source to test next, identifying high operating costs, or finding a source whose apparent volume disappears after sales acceptance.
Pause when zero or one outcome determines the rate, source assignment is mostly unknown, sales changes acceptance criteria mid-window, a single account dominates results, cohorts receive materially different offers, or the sales cycle is still maturing. In those cases, report a readiness score and the missing evidence instead of a ranking. “Insufficient” is a valid conclusion.
Trace the actual signal-to-outcome chain
Intent data can define a research-theme cohort. Fit can narrow it to economically plausible accounts. Identity resolution can estimate the associated account or person. Freshness can determine eligibility duration. Activation logs show whether the record reached ads, outbound, or sales. CRM outcomes show acceptance. Keep every layer visible so an executive can distinguish signal quality from workflow performance.
MarketPulse supplies topic research and available match details. TrafficID separately supports own-site visitor review. AIMEE can organize supplied context through configured tools. Custom dashboards, scoring, client interfaces and routing require separately verified implementation, rights, scope and fees.
Use source-level reason codes and expiry rules. A record with high fit but expired intent should not remain in a recent-intent cohort. A high-confidence company match without contact permission should not automatically enter outreach. The metric must inherit the governance of the underlying workflow.
Check selection and cost distortion
Attribution bias gives credit to the visible source while ignoring prior demand. Selection bias places better accounts in one cohort. Survivorship removes failed or unmatched records. Contamination occurs when the same account crosses multiple treatments. Misallocated shared cost changes the numerator. Inconsistent sales acceptance changes the denominator. Signal decay, identity errors, and late CRM entry create additional distortion.
Include actual review, suppression, access, retention, correction, deletion and governance work in defined costs. A source is not efficient merely because necessary work was omitted. Hold unresolved source, recipient, channel and purpose checks before action.
Scope separate client comparison reporting
An agency should report the comparison model, not a source leaderboard without context. Show the exact formula, source-cost waterfall, accepted-opportunity definition, cohort maturity, evidence grade, caveats, and next test. For renewal, connect the service to improved decision quality and operational accountability rather than attributing every opportunity to the intent source.
Review an available MarketPulse topic, saved ICP and actual preceding-24-hour matches for the approved research purpose. Keep uncertain company context visible. AIMEE can organize supplied context through configured tools; named owners approve actual exports, messages, audience uploads and CRM writes.
Keep the research subscription distinct from agency reporting and optimization work. Verify actual access, branding, usage, implementation, recipient rights, responsibilities and separate fees. A subscription does not establish client portal or reporting entitlements.
Copyable source-economics comparison
Decision: [Actual next bounded investment.] Cohort: [Eligible unit, source rule, period and maturity.] Cost: [Direct, shared, setup, failed work and allocation.] Opportunity: [Acceptance criteria, owner and unique ID.] Evidence: [Method, comparator, overlap and missingness.] Sensitivity: [Alternate cost and outcome assumptions.] Action: [Approver, test limit, repair and stop rule.]
Shared-cost allocation can change a ranking
The Green Book’s appraisal guidance tests how uncertain assumptions change outcomes. It concerns government appraisal, not a BrandWell return benchmark. Use a disclosed sensitivity view for management allocation assumptions.
Assume fictional source A has $1,000 direct cost and five accepted opportunities; B has $1,500 and six. Shared operating cost is $1,000. Allocating half to each gives A $1,500/5 = $300 and B $2,000/6 = $333.33 per opportunity. Allocating $800 to A and $200 to B gives A $360 and B $283.33. The ranking reverses without any new opportunity. Keep the allocation and rationale visible. These invented inputs are not BrandWell service fees or performance results.
Count unique opportunities before adding sources
If A has five opportunity IDs and B has six, with two IDs appearing in both, the unique union is nine, not 11. Preserve both source appearances but choose and disclose the cost-comparison assignment rule. A first-source convention does not establish causal credit or erase later touches.
Keep zero and unresolved cohorts visible
A fictional source with $500 defined cost and zero accepted opportunities has no finite cost-per-opportunity ratio. Display the $500 and zero count rather than $0 per opportunity or an omitted row. If outcomes are still pending, label them unresolved and preserve the observation age. One later acceptance would produce $500 per opportunity under those defined costs, illustrating low-count instability.
Subscription price is only one cost input
A fictional test using the standard $500 Growth subscription, $400 setup and $600 review has $1,500 defined first-period costs. Five accepted opportunities give $300 each. If just three meet the unchanged acceptance definition after audit, the ratio becomes $500 each. Acquisition, media, general overhead, tax and financing are excluded. These invented service inputs are not BrandWell agency-service pricing or typical opportunity costs.
Verify the actual research handoff
Review an available MarketPulse topic, saved ICP and actual preceding-24-hour matches for the approved purpose. Preserve uncertain company context. AIMEE can organize supplied research through configured tools. Owners approve exports, messages, Outreach enrollment, audience uploads and CRM writes. Custom comparison dashboards, reports, scoring and routing require separately verified implementation, rights, scope and fees.
Frequently asked cost-per-opportunity questions
Can shared-cost allocation reverse a source ranking?
Yes. Show alternate allocations and their rationale.
Can opportunities appearing in two sources be added twice?
No. Preserve unique IDs and the disclosed assignment rule.
Does zero opportunity mean zero cost per opportunity?
No. Display actual cost, zero outcomes and maturity.
Does a cheaper source prove incremental revenue?
No. The comparison method must support that conclusion.
Review the research product: explore MarketPulse and current plans.
Reviewed and updated October 3, 2026.

Written by