On this page
- The short answer: forecast the service as cohorts, not a single growth percentage
- Forecast architecture: six linked schedules
- Minimum input dictionary
- Cohort forecast model
- Illustrative low, base, and high case
- Sensitivity: the assumptions that move the forecast most
- Capacity model: revenue cannot outrun delivery
- BrandWell package assumptions inside the model
- Forecast service mix, not only client count
- Metrics and forecast-accuracy review
- Forecast quality-control checklist
- Risk register and failure scenarios
- How to turn the forecast into operating decisions
- Frequently asked questions
- Reproduce the scenario before using it
- Use actual MarketPulse allowances in the cost schedule
Forecast recurring revenue from an intent-data service with a client-cohort roll-forward constrained by delivery capacity, not by multiplying a hopeful client count by a headline price. Model opening recurring revenue, new clients, expansion, contraction, churn, variable usage, direct delivery cost, and capacity separately. In other words, forecasting recurring revenue from intent services means publishing low, base, and high cases, then replacing assumptions with actual cohort behavior every month.
Who this is for. This guide is for agency owners, finance leads, operators, and resellers planning a recurring buyer-intent service. It is a forward model for client mix, churn, capacity, and gross margin – not a promise, valuation, retail-pricing recommendation, or retrospective ROI analysis. Accounting, tax, financing, and revenue-recognition decisions need qualified review.
Current MarketPulse offer: intent-data plans start at $500/mo. See the product, demo, and current plans. Updated October 1, 2026.
The short answer: forecast the service as cohorts, not a single growth percentage
An agency forecast should answer four questions:
- How many paying clients will be active in each month?
- What recurring and variable revenue will those clients produce under their actual package mix?
- What direct data, platform, labor, and client-specific costs will be consumed?
- Which constraint stops the agency from adding or retaining more clients?
The core monthly roll-forward is:
Ending recurring revenue = opening recurring revenue + new recurring revenue + expansion + reactivation − contraction − churned recurring revenue.
Track client counts in a parallel roll-forward. Do not hide churn by adding new logos. Do not treat one-time setup, pass-through ad spend, or uncertain overage as recurring revenue. If a client prepays, normalize the recurring service value to the month while keeping cash timing separate.
The bridge in this article is a proposed management model. Define each movement in your billing policy, reconcile it to actual client records and preserve the policy version. Monthly recurring revenue is a management metric; it is not cash collected or accounting revenue recognition.
Forecast architecture: six linked schedules
A decision-grade workbook needs six schedules rather than one revenue tab.
1. Client cohort schedule
Create one row for each client and fields for sales cohort, service start, package, monthly recurring price, term, ramp period, renewal date, probability-adjusted launch status, churn or contraction assumption, and capacity profile. Actual clients should replace probability assumptions once contracted.
Group clients by start month, niche, package, acquisition source, delivery model, and operator. Cohorts reveal whether a niche or package retains better. A blended churn rate can conceal that the agency is replacing weak-fit clients every month.
2. Sales conversion schedule
Forecast qualified opportunities, proposals, wins, implementation starts, and activation dates. Apply probability to unsigned pipeline, but never count a prospect as MRR until the chosen policy’s activation or paid-start event occurs. Separate sales capacity from fulfillment capacity.
3. Revenue schedule
Split recurring service, contracted variable minimums, uncertain usage, setup projects, and other one-time work. Expansion should require a documented trigger such as an added client market, topic set, activation channel, or service level – not an arbitrary percentage.
4. Direct cost and gross-profit schedule
Allocate platform licensing cost, variable data usage, direct fulfillment labor, client-specific tools, report production, quality review, and other direct delivery costs. Keep general sales and administrative expense outside gross profit but include it in cash and operating-profit planning.
5. Capacity schedule
Model topic and data allowances, analyst hours, client-success load, report reviews, integrations, workflow monitoring, and approval queues. A platform may support another client while the agency lacks review or client-service capacity. The lowest constraint controls.
6. Cash and billing schedule
Translate revenue into invoice and collection timing. Annual prepayment improves cash but does not multiply monthly recurring revenue. Usage billed in arrears can create a working-capital delay. Failed payments and credits affect cash and revenue quality.
Minimum input dictionary
Every assumption should have an owner, source, update cadence, and low/base/high value.
| Input | Definition | Evidence source | Update cadence |
|---|---|---|---|
| Opening clients and MRR | Active, paid recurring clients at month start | Billing ledger and contract schedule | Monthly close |
| New-client starts | Clients that begin paid recurring service | Signed orders and implementation plan | Weekly pipeline review |
| Average recurring revenue | MRR divided by active paid clients under a fixed policy | Client-level billing export | Monthly |
| Logo churn | Clients ending all recurring service during period | Cancellation and billing records | Monthly plus cohort review |
| Revenue contraction | MRR lost from retained clients | Package and order changes | Monthly |
| Expansion | Added recurring scope from existing clients | Signed change orders | Monthly |
| Variable usage revenue | Billed use not included in base MRR | Reconciled usage ledger | Monthly |
| Platform allocation | Defensible share of fixed platform cost | Vendor invoice and client allocation rule | Monthly |
| Variable data cost | Direct cost driven by use | Upstream usage statement | Monthly |
| Fulfillment hours | Direct delivery time by client and work type | Time or workflow log | Weekly |
| Capacity ceiling | Lowest sustainable constraint across data, labor, support, and workflow | Capacity schedule and observed service levels | Monthly |
| Collection lag | Time from invoice to cash | Accounts receivable ledger | Monthly |
Swipe the table to see all columns.
Do not borrow “industry standard” churn or margin without a source and fit rationale. For a new service, use conservative ranges, run a pilot, and label every number as an assumption.
Cohort forecast model
For each cohort c and month t:
Active clients(c,t) = prior active clients + new starts − churned clients.
Cohort MRR(c,t) = active clients × average recurring price + expansion − contraction.
Gross profit(c,t) = recurring revenue + variable revenue − platform allocation − variable data − direct labor − client-specific tools.
Gross margin % = gross profit ÷ revenue.
Use expected fractional clients only in a planning model. The operating plan still deals in whole clients. Once a named prospect signs, move it out of probability-weighted pipeline and into the contracted cohort with the real start date and scope.
Churn should be applied to the clients at risk under the agency’s definition. A client in a seven-day pilot is not an active recurring client unless it has converted under the stated policy. A paused or past-due client needs consistent treatment. Do not change definitions between scenarios to improve the result.
Illustrative low, base, and high case
The following numbers are hypothetical inputs for demonstrating the mechanics, not BrandWell results, pricing guidance, market benchmarks, or a promise. All three cases begin with four active clients. Expected client counts are fractional because probability is being modeled.
| Input or result | Low case | Base case | High case |
|---|---|---|---|
| Average new starts per month | 0.5 | 0.8 | 1.1 |
| Monthly logo churn assumption | 5% | 3% | 2% |
| Illustrative average client MRR | $2,500 | $3,000 | $3,500 |
| Capacity ceiling | 10 clients | 12 clients | 14 clients |
| Illustrative gross-margin assumption | 40% | 55% | 65% |
| Expected active clients at month 12 | 6.8 | 10.9 | 14.0, capacity-limited |
| Month-12 MRR | about $16,900 | about $32,800 | $49,000 |
| Sum of monthly recurring revenue over 12 months | about $169,000 | about $286,900 | about $423,000 |
| Month-12 gross profit at assumed margin | about $6,800 | about $18,100 | about $31,900 |
Swipe the table to see all columns.
The high case hits capacity, so additional demand does not become revenue unless the agency adds capacity or improves delivery efficiency. The low case shows why churn and slow starts compound. The base case is not “most likely” by default; it is merely the management case that should be tied to current pipeline and operating evidence.
Do not call the 12-month sum “ARR.” It is the sum of forecast monthly recurring revenue within the year. Month-12 MRR multiplied by 12 is a run-rate annualization, not revenue already earned or contracted.
Sensitivity: the assumptions that move the forecast most
Run a one-variable and combined sensitivity around:
- new-client start rate and implementation delay;
- average recurring price and package mix;
- logo churn and contraction by cohort;
- time needed for new clients to reach full service level;
- usage variability and how much is billable;
- identity matchability and qualification acceptance, because both affect fulfillment and perceived value;
- direct analyst and client-service hours;
- platform capacity and topic-count requirements;
- collections and credit rate;
- renewal concentration in a single month.
For a simplified single-package model with constant price and variable cost, estimated break-even clients equal fixed costs divided by contribution per client, where contribution is price minus variable cost. This algebra excludes stepped staffing, mixed packages and timing effects. If contribution is zero or negative, this model has no positive finite break-even. Define each cost once.
Combine sensitivities for a stress case. Lower starts, a one-month onboarding delay, higher churn, and more labor can occur together. A model that changes only one favorable variable at a time understates risk.
Capacity model: revenue cannot outrun delivery
Calculate a ceiling for each constraint:
Labor capacity = available direct-delivery hours ÷ average hours per active client.
Client-success capacity = available relationship hours ÷ average client-service hours.
Report capacity = reviewed reports available ÷ reports per client.
Platform capacity = contracted client, topic, usage, or workspace allowance translated into sustainable clients.
Sustainable active clients = minimum of all applicable ceilings, with a buffer.
Do not plan to 100% utilization. Leave room for incidents, rework, renewals, training, vacations, and uneven usage. Capacity is also skill-specific: an integration specialist cannot always substitute for a client strategist.
When the forecast reaches a ceiling, choose among raising price for future scope, narrowing deliverables, improving automation with QA, adding people, purchasing more capacity, changing client mix, or delaying starts. Do not accept every client and hope gross margin survives.
BrandWell package assumptions inside the model
Enter the actual current plan or signed order into the platform schedule. Identify fixed and variable costs, topic and usage limits, support and implementation work. Allocate them using a defensible rule. Do not infer topic exclusivity, native client portals or reseller capacity from a standard MarketPulse subscription. Keep the agency’s retail pricing and client billing separate.
Start by reviewing the MarketPulse demo and plans, starting at $500/mo. Choose a relevant topic and ICP, then evaluate audience fit, available contact fields, and the workflow you will use. The first-purchase 3-day satisfaction guarantee requires no data exports and no more than 2 Intent Scans; review the current guarantee terms before testing. A short evaluation can establish fit, but cannot prove future pipeline or revenue.
Use AIMEE through configured tools for a bounded draft of the assumptions or review notes. A named owner checks source figures, formulas and actions. Tool availability does not establish forecast accuracy or a native client-billing system.
Forecast service mix, not only client count
Two agencies with ten clients can have very different economics. Create package archetypes such as report-only topic monitoring, topic plus website identification, activation support, or a higher-touch managed workflow. For each, specify topics, data units, report cadence, review hours, client-service load, destinations, and evidence obligations.
Then forecast the mix. A high-touch package may carry more recurring revenue but consume scarce strategist time. A low-touch report may have strong margin but weak retention if the client cannot act. A usage-heavy client may look attractive in revenue while producing low gross profit and invoice disputes.
Also model client concentration. If one client represents a large share of MRR, a blended churn percentage hides discontinuity risk. Show the result of losing the largest client, delaying the three biggest renewals, or contracting one high-usage account.
Metrics and forecast-accuracy review
At every monthly close, compare forecast to actual for:
- active clients and start dates;
- new, expansion, contraction, churn, and reactivation MRR;
- variable usage revenue and direct usage cost;
- package and niche mix;
- implementation duration;
- fulfillment and client-service hours;
- gross profit and gross margin;
- platform, topic, and workflow utilization;
- invoices, credits, collections, and late payments;
- accepted, rejected, activated, and disposed signals;
- opportunity and revenue outcomes with attribution caveats.
Track forecast error by driver, not only total revenue. If revenue is correct because unexpected expansion offset unexpected churn, the model was still wrong. Record the explanation and update only the assumption supported by evidence.
Use a rolling forecast: close the actual month, add a new outer month, and preserve the prior forecast for comparison. Do not overwrite history. Run a weekly 13-week cash view alongside the monthly recurring model when liquidity matters.
Forecast quality-control checklist
Before management uses the model, have someone other than the author check it. Reconcile opening clients and MRR to the billing ledger. Confirm that annual contracts are monthly-normalized consistently and that one-time setup is excluded from recurring revenue. Trace every signed new client to a start date and every probability-weighted prospect to the sales pipeline. Make sure churn removes both the client and its recurring revenue, while contraction preserves the client.
Test that the capacity ceiling actually stops starts or creates a visible backlog. Change one input at a time and confirm the related output moves in the expected direction. Inspect formulas copied across months, scenario switches, circular references, hidden rows, hard-coded totals, mixed currencies, taxes, and sign conventions. Recalculate the low/base/high example independently.
Finally, run four destructive tests: zero new sales, loss of the largest client, a one-month implementation delay, and a direct-cost spike. The model should produce plausible results without broken formulas. Record the workbook version, owner, review date in private finance metadata, and the assumptions management approved. Do not present a scenario table to staff or investors without the definitions and constraints that produced it.
Risk register and failure scenarios
The forecast can fail because signals are sparse, identity matchability is low, clients cannot act, delivery is too manual, sales starts slip, a platform tier changes, a large client churns, usage costs spike, invoices are disputed, or the agency confuses influenced outcomes with incremental revenue.
Maintain trigger-and-response pairs. For example: if qualified signal volume is below the agreed threshold for two periods, review topic and market fit before adding spend. If analyst utilization exceeds the safe ceiling, pause start dates or narrow scope. If gross margin falls because of rework, fix the workflow before selling more. If a client cannot return dispositions, downgrade forecast confidence for renewal and expansion.
Unresolved data rights, security requirements or permitted-use questions can stop a planned launch. Include review and remediation costs and use only documented contractual rights. A product subscription does not establish exclusive topic access.
How to turn the forecast into operating decisions
A forecast is useful only when it changes decisions. Set thresholds for hiring, contractor capacity, platform upgrades, marketing spend, client acceptance, and cash reserves. Tie each threshold to a leading measure and a responsible owner.
For example, begin recruiting before the base case reaches safe capacity, but make the final commitment only when contracted starts and cash support it. Expand topics or activation modules after a client demonstrates adoption, not merely because the high case assumes expansion. Hold a monthly revenue-and-capacity review with sales, finance, delivery, and client service using the same definitions.
Start by reviewing the MarketPulse demo and plans, starting at $500/mo. Choose a relevant topic and ICP, then evaluate audience fit, available contact fields, and the workflow you will use. The first-purchase 3-day satisfaction guarantee requires no data exports and no more than 2 Intent Scans; review the current guarantee terms before testing. A short evaluation can establish fit, but cannot prove future pipeline or revenue.
Frequently asked questions
How should an agency forecast recurring intent-service revenue?
Use client-level or cohort roll-forwards for opening MRR, new, expansion, contraction, churn, and reactivation. Constrain the result by delivery capacity and model cash separately.
Which inputs and update cadence are required?
Use actual billing, contracts, pipeline, usage, time, cost, and collections. Update pipeline and capacity weekly, close actual revenue monthly, and review cohort retention as enough history accumulates.
Which tools or templates help?
Use linked client, sales, revenue, cost, capacity, and cash schedules with assumption owners, scenario values, historical versions, and forecast-versus-actual explanations. Software cannot repair undefined metrics.
Which forecast methods should be compared?
Compare named-client pipeline, cohort roll-forward, driver-based package mix, capacity-constrained planning, and cash forecasting. Use them together rather than selecting one headline growth percentage.
What pricing and cost assumptions matter?
Model actual client recurring price, package mix, platform licensing scope, variable data, labor, tools, credits, implementation, and collection timing. Label any hypothetical figures clearly.
Which metrics indicate revenue quality?
Review MRR bridge, gross margin, cash collection, concentration, churn, contraction, expansion, utilization, direct hours, dispute rate, and evidence completeness – not just new logos.
Which client models forecast best?
Repeatable packages with clear starts, measurable units, stable cadence, client action owners, and feedback loops are more forecastable. Bespoke work and outcome-only fees create volatility.
How do signals and identity affect revenue forecasts?
Signal density, identity matchability, enrichment quality, qualification acceptance, activation, and client disposition influence delivery effort, adoption, retention, and expansion. None guarantees revenue.
What are the largest forecast risks?
Overstated starts, ignored implementation lag, understated churn and labor, capacity bottlenecks, client concentration, usage variance, collections, scope creep, data-rights issues, and causal overclaiming.
How should the model evolve as the agency scales?
Replace assumptions with cohort evidence, segment by niche and package, add capacity and concentration tests, automate reconciliations, preserve forecast versions, and use thresholds to govern hiring and client starts.
Reproduce the scenario before using it
The fictional table above starts with four clients. For each of 12 months, calculate ending clients as the smaller of the capacity ceiling and prior clients × (1 − churn rate) + new starts. Apply churn to opening clients before adding that month’s starts. Monthly revenue equals ending clients × the constant scenario price; sum those 12 monthly values. There is no expansion, contraction, reactivation, launch delay or collection loss in this illustration.
This recurrence yields month-12 clients of 6.7578, 10.9396 and 14.0. Unrounded month-12 revenue is $16,894.60, $32,818.72 and $49,000; the 12-month sums are $169,002.62, $286,861.40 and $423,027.31. The table rounds these values. At the stated hypothetical margins, month-12 gross profit is $6,757.84, $18,050.30 and $31,850. These outputs are calculations, not forecasts supported by historical BrandWell performance.
For a real cohort, either calculate revenue from actual client-level prices or use a fixed opening-price base plus separately recorded price and scope movements. Do not both update the average price and add the same expansion again. Distinguish expected fractional clients from actual whole-client delivery and keep cash timing separate.
SBA’s business-planning resources cover business plans and financial projections. The scenario and recurrence here are author-created, not SBA benchmarks or accounting rules.
Use actual MarketPulse allowances in the cost schedule
MarketPulse standard plans are starting at $500/mo for one topic with weekly refreshes. Growth includes three topics with daily pulls; Scale includes ten topics with daily pulls. Fields, audience sizes and overlap vary.
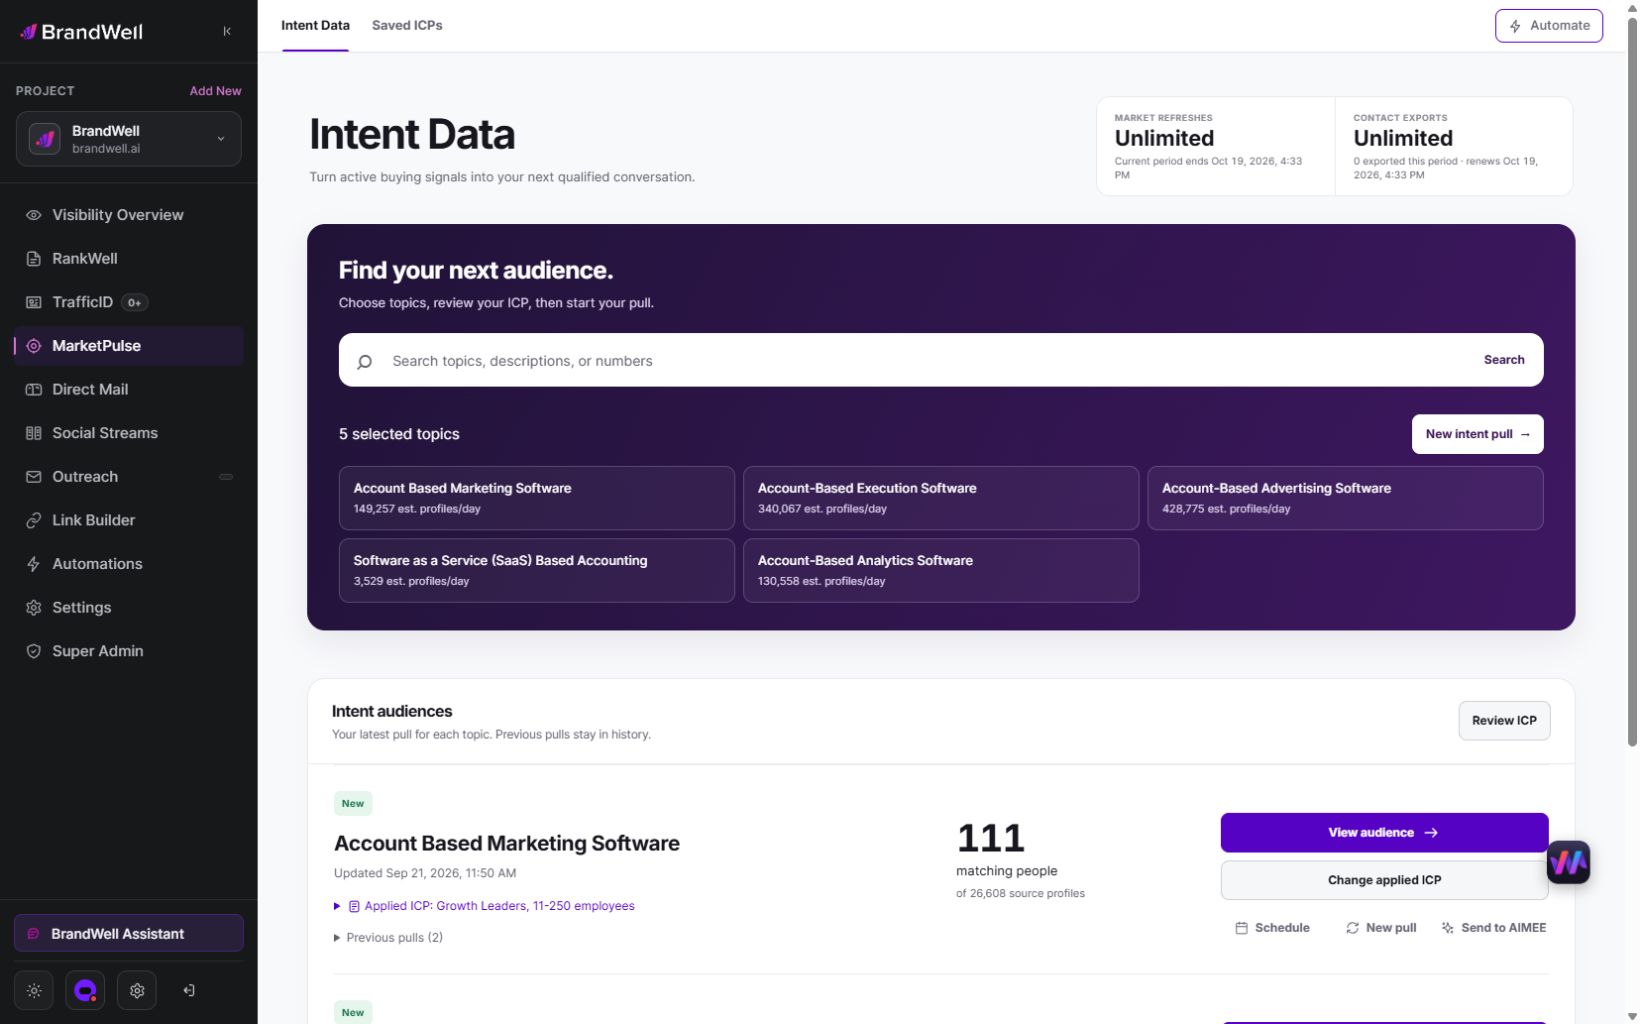
Record the actual plan cost and service work, inspect one topic and ICP, and test the delivery process before forecasting scale. Watch the demo and review current plans.
Reviewed and updated October 3, 2026.

Written by