On this page
A high bounce rate means a large share of sessions did not meet your analytics system’s engagement criteria. It is a signal to investigate, rather than proof that every visitor disliked the page. Start by checking the metric definition, measurement setup and purpose of the visit.
For Google Analytics 4, bounce rate is the complement of engagement rate. It is not simply the percentage of people who view one page and leave immediately. Using the wrong definition can lead a team to fix the wrong problem.
How GA4 defines a bounce
Google’s GA4 engagement and bounce-rate documentation defines engaged sessions as those lasting longer than ten seconds, recording a key event, or including at least two page or screen views. Bounce rate is the percentage of sessions that are not engaged.
A one-page visit can therefore be engaged. A reader does not have to visit a second article for every session to count as useful. Conversely, a recorded engagement is not necessarily a qualified lead or a satisfied customer.
What counts as a high bounce rate?
There is no universal cutoff in this guide. Compare similar pages, audiences and measurement periods. A short answer page, a product comparison and a checkout page serve different tasks. Old benchmark lists may use a different analytics definition or population.
Review the page’s purpose alongside relevant actions. If someone finds a support answer and leaves, that can differ from someone abandoning a broken request form. Bounce rate alone cannot tell you which happened.
A worked example
Suppose a page receives 1,000 measured sessions and 650 are engaged. Engagement rate is 65%, so bounce rate is 35%. These hypothetical figures demonstrate the calculation; they are not a performance benchmark.
Now suppose the mix changes to include more mobile visitors from a broad campaign. The overall bounce rate increases even though each existing audience behaves similarly. That is why you should compare device and acquisition groups, rather than assuming the article became worse.
Also check whether tagging or key-event configuration changed. A lower bounce rate after adding an event does not, by itself, prove that people found the page more useful.
Diagnose the issue in a sensible order
1. Confirm the measurement
Check that important pages are tagged consistently, events are not duplicated and meaningful actions have appropriate definitions. Review consent-related differences and changes to collection. Keep those limitations visible when interpreting the report.
To view the metric in GA4, an Editor or Administrator can customize a detail report and add engagement rate and bounce rate. Google notes that these metrics are not included in most reports by default. Review the report’s scope before comparing it with another one.
2. Separate the audience groups
Compare the landing page by device, source and campaign over comparable periods. A broad ad, an outdated referral or a mismatched promise may bring readers who need something the page does not offer.
Keep search and on-site analytics distinct. Search Console impressions and CTR describe search visibility and clicks. GA4 bounce rate describes measured sessions after arrival. One metric cannot substitute for the other.
3. Check the promise and opening answer
Make the headline, description and campaign message consistent with the page. Give the reader the answer early, then add supporting detail. A generic introduction can delay the information people came for.
Do not expand an article merely to keep people on it longer. Add depth when it resolves an important question, demonstrates the workflow or supports a claim. Remove repetitive material that gets in the way.
4. Test the actual mobile experience
Open the page on a narrow screen. Check readable text, image loading, usable links, horizontal overflow, navigation and the form. Try the intended action, including validation errors and the success state.
Use performance diagnostics to investigate loading issues, then verify the result in the browser. A score alone does not establish that the visitor can complete the task. Avoid disruptive overlays that conceal the answer or block the controls.
5. Review the next step
A relevant link, demo or checklist can help a reader continue. Choose the action that fits the content; do not force extra pageviews just to change the metric. Review inquiries and customer outcomes separately from engagement.
Use BrandWell to improve the content
Bring the reader question, approved facts and source material into RankWell when revising a page. The Content Hub organizes article, strategy, queue and calendar work. The current editor brings together the draft, sources, media, search preview, recommendations and history.
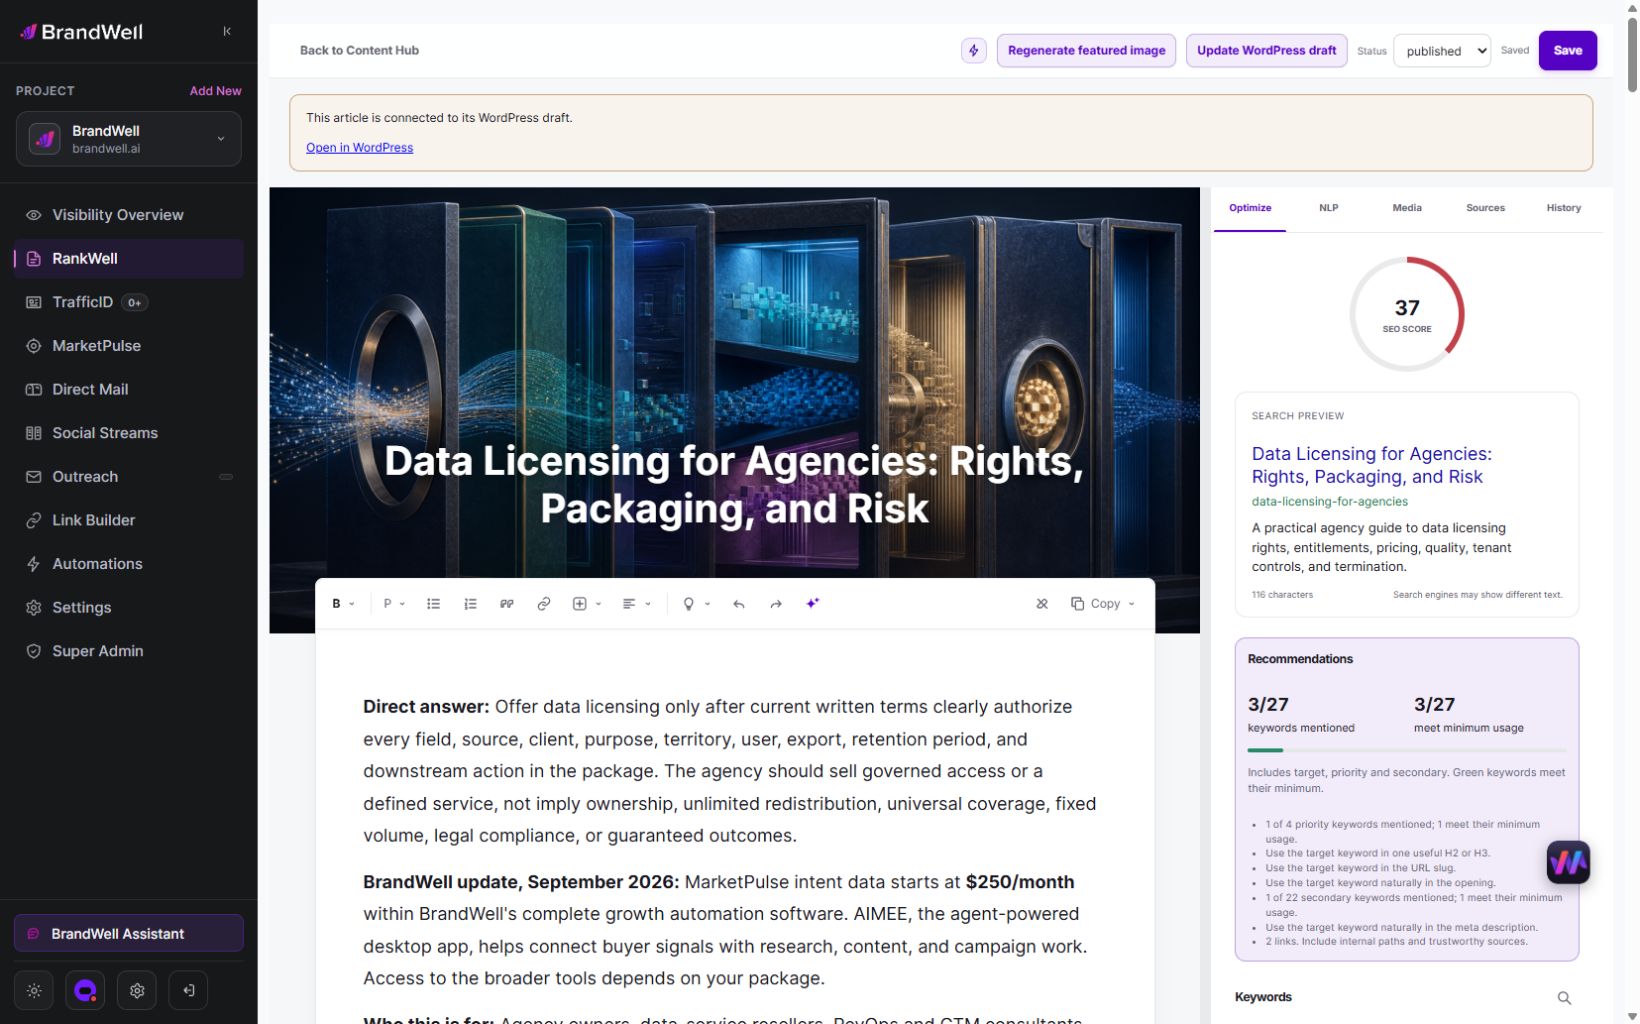
Rewrite unclear sections, verify evidence and update outdated product screenshots. Review the search preview for a faithful description, then approve the finished page at its configured publishing destination. Analytics diagnosis and browser testing still require their own checks; a generated draft does not prove engagement improved.
Measure the change without gaming the metric
Record what changed and when. Compare similar periods and acquisition groups, then review relevant customer actions. Explain changes in tagging, consent, campaign targeting or page purpose that could affect the comparison.
Do not mark trivial interactions as important merely to lower bounce rate. Your reporting should help the team understand the experience, not manufacture an attractive number. A page that produces fewer measured bounces but fewer qualified inquiries may need further review.
Frequently asked questions
Is a one-page visit always a bounce?
No. In GA4, it can meet the engaged-session criteria. Use the current metric definition rather than the older assumption that one pageview always means a bounce.
Does a high bounce rate prove the content is poor?
No. Check measurement, audience fit and the visitor’s task first. Content and usability problems are possibilities to investigate, not conclusions the metric establishes alone.
Will reducing bounce rate guarantee better rankings?
No. Do not treat a change in an analytics metric as a promise of search performance. Improve the actual experience and measure relevant search and customer outcomes separately.
What should I fix first?
Fix a confirmed measurement or functional error first. Then address the strongest evidence of a mismatch between the visitor’s expectation and what the page provides.
Explore RankWell to build evidence-based content review into your current BrandWell workflow.
Reviewed and updated October 3, 2026.

Written by
Julia McCoy has contributed articles to BrandWell on content marketing, writing, and search engine optimization. This archive retains her original bylines; individual articles may be updated by the BrandWell editorial team.