On this page
- Current MarketPulse research workflow
- Define capacity and outcome units
- Compare five portfolio designs
- Build a bounded tiering workflow
- Choose tools for the actual work
- Budget full costs and contribution
- Measure distinct evidence and outcomes
- Check actual operating prerequisites
- Review data and action requirements
- Separate research from agency delivery
- Frequently asked portfolio questions
- Copyable portfolio comparison
Compare broad coverage and research-prioritized work against the actual market, common account and outcome units, staff capacity, source limitations, full costs and follow-up window. Define eligibility, evidence tiers, approval, expiry and feedback before increasing volume. Neither a broad list nor recent topic research establishes a buyer. Test which allocation changes useful action instead of assuming one motion is universally superior.
Who is this for? B2B founders, demand-generation leaders, RevOps teams, sales leaders, and agencies deciding whether to fund broader list, content, or paid acquisition programs; narrower intent-led plays; or a governed combination of both.
Current MarketPulse offer: intent-data plans start at $500/mo. See the product, demo, and current plans. Updated October 3, 2026.
Current MarketPulse research workflow
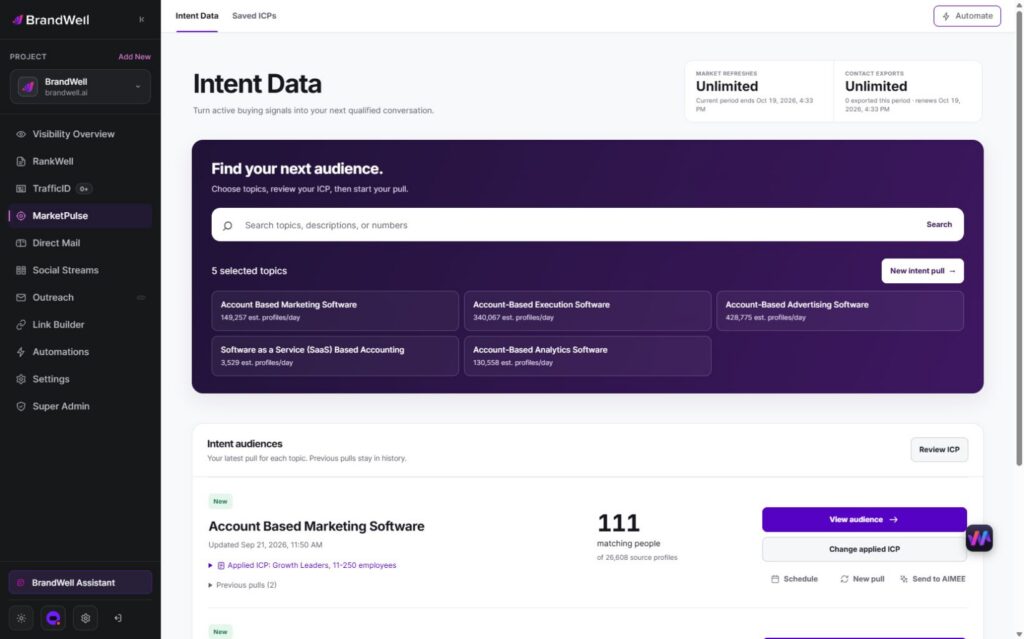
BrandWell MarketPulse: intent data starting at $500/mo. Find people researching topics relevant to what you sell, apply saved ICP filters, and review available contact details before taking action.
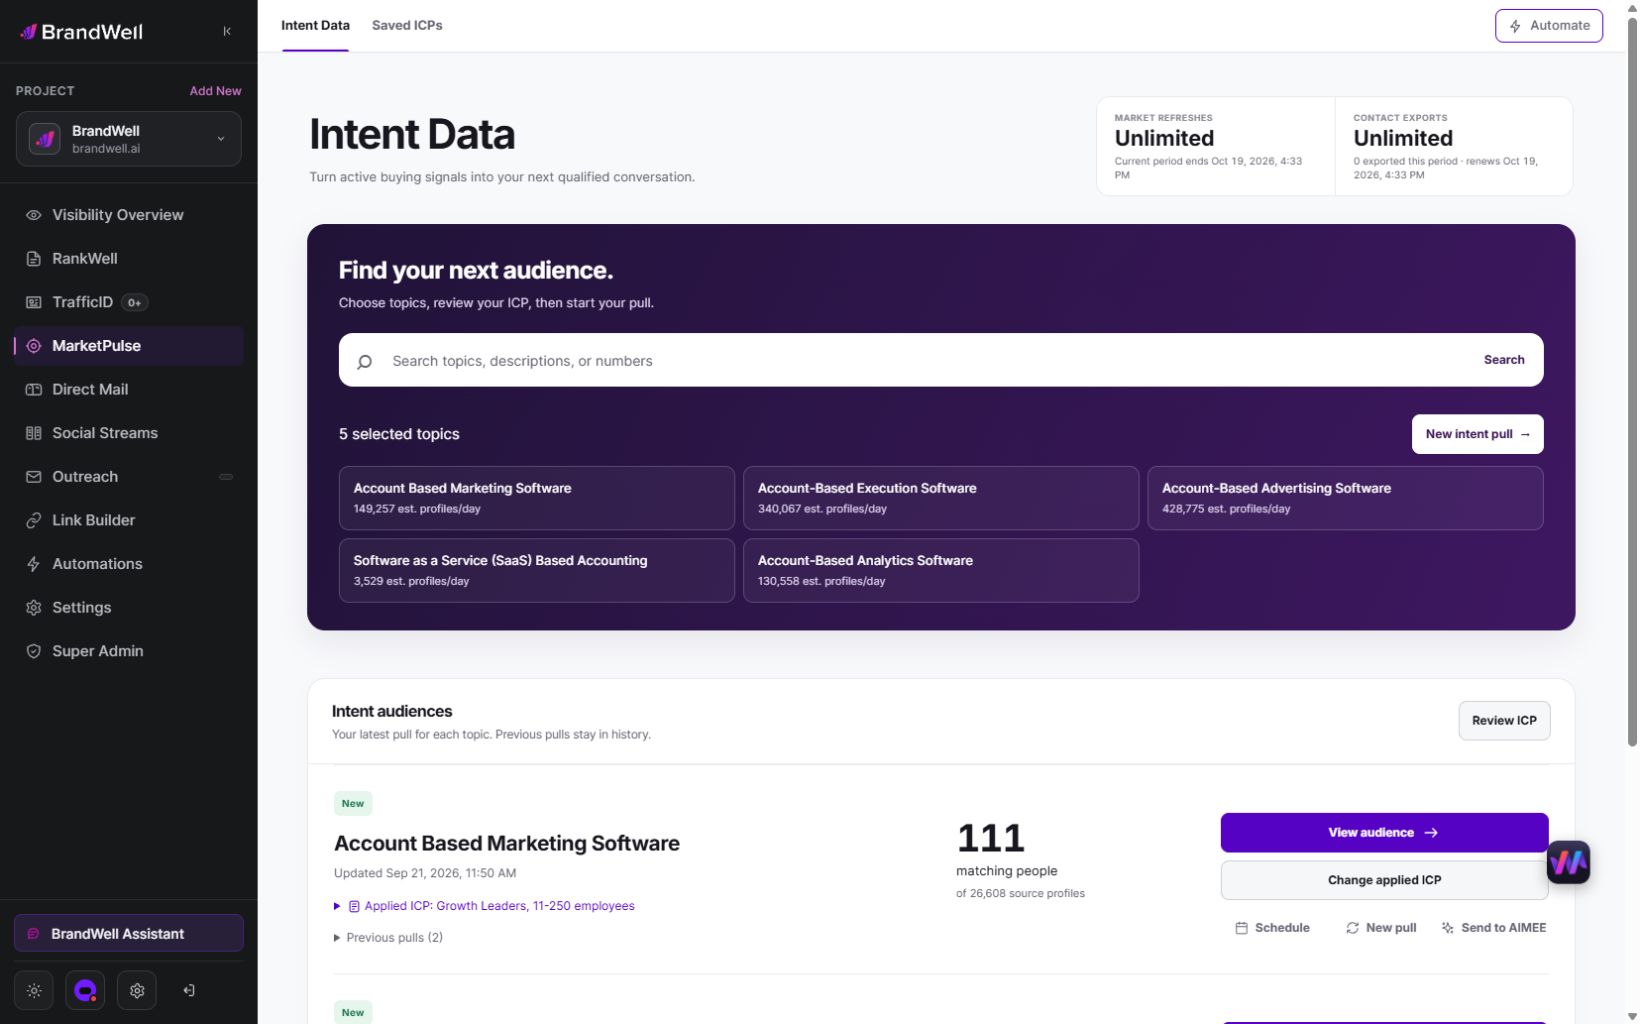
MarketPulse plans are starting at $500/mo. Verify current package scope and offers on the product page.
| Plan | Topics and refreshes | Monthly exports |
|---|---|---|
| Starter | 1 topic, weekly | 25,000 contacts |
| Growth | 3 topics, daily | 100,000 contacts |
| Scale | 10 topics, daily | Unlimited contacts |
Swipe the table to see all columns.
A pull retrieves available data from the previous 24 hours for one topic. Daily use across all included topics provides 90 Growth pulls or 300 Scale pulls in a 30-day month. Weekly Starter pulls vary by calendar month. Available audience size and contact fields vary, and audiences may overlap. Refreshes stop at the plan limit without overage charges.
- Find and qualify: search the topic catalog, save your ICP, and review the people and companies that match.
- Act on the research: export qualified contacts or prepare an Outreach or Direct Mail workflow. Connected products, channel usage, and fulfillment may cost extra.
- Get help from AIMEE: Growth and Scale include AIMEE for the initial user to research accounts and prepare the next step through connected tools.
Agencies and other service businesses can build client deliverables around their available Intent Scans and exports. Keep each client’s scope, permissions, and service fees clear. A subscription is not a promise of a white-label platform or exclusive access to a market.
Explore MarketPulse and watch the demo or compare plans starting at $500/mo. Any early-access discount is a separate, time-limited offer shown to an eligible recipient.
Define capacity and outcome units
High-volume versus high-intent lead generation is not a contest between “bad lists” and “ready buyers.” A broad source can contain excellent future customers, and an intent signal can be irrelevant, stale, misresolved, or generated by someone with no authority. The real decision is how much scarce research, media, and seller time to allocate to different evidence tiers.
Define four denominators before comparing programs: reachable accounts in the market, leads or accounts entering each tier, accepted sales work, and qualified outcomes. Then write the constraints: seller capacity, average research and follow-up minutes, time to first action, deal value, gross margin, sales cycle, data and media cost, and acceptable false-positive rate. Cost per lead without those denominators rewards cheap noise.
Estimate required time for every review, validation, rejection, exception and approved action, with the actual skill and period named. Mean work per record can support an aggregate estimate for a representative workload; a median cannot be multiplied into total hours. Specialist capacity, arrival patterns, service windows and missing time can constrain the actual queue even when aggregate hours appear sufficient.
Compare five portfolio designs
Compare each portfolio on operating prerequisites, inputs, owners, limitations, cost drivers, actual outcomes and uncertainty. Define the eligible market and buyer outcome before reviewing the results.
1. Coverage-first volume generation
Operating prerequisite: Use a coverage-first model when the addressable market is large, the offer is easy to understand, acquisition channels can operate economically, and nurture or product-led conversion absorbs demand without intensive seller work.
Inputs: A clean ICP universe, reachable contact or audience data, source and permission records, channel eligibility, offer-to-segment mapping, suppression, validation, and a documented transition from marketing engagement to human sales attention.
Implementation ownership: Demand generation owns acquisition; marketing operations controls capture and consent; RevOps defines stage changes; sales accepts only records that meet a service-level agreement. Automation can handle routing and nurture, but quality sampling remains a human responsibility.
Risk: The program can optimize toward inexpensive form fills, job seekers, students, micro-businesses, bots, duplicate contacts, or people outside the buying committee. High activity may hide low seller acceptance and reputation cost.
Cost drivers: Media or content production, list or audience data, landing pages, enrichment, validation, nurture, deliverability, lead operations, and the labor required to reject and recycle weak records.
Measurement: Measure reachable coverage, validated rate, cost per accepted lead, marketing-to-sales acceptance, qualified opportunity rate, velocity, and total cost per qualified outcome – not just lead count or top-line cost per lead.
Meaningful limitation: Volume creates optionality and learning but cannot manufacture sales capacity or purchase timing. If qualification is weak, scale increases waste faster than pipeline.
2. Intent-first prioritization
Operating prerequisite: Use an intent-first design when deals are valuable, the market is finite, seller research is expensive, buying cycles create observable signals, and the team benefits from choosing which accounts to investigate now.
Inputs: A target-account universe, approved topic dictionary, first-party and permitted off-site evidence, fit, recency, account and identity confidence, validation, suppressions, seller capacity, and a qualified-outcome feedback loop.
Implementation ownership: GTM strategy defines topics and evidence tiers; data operations maintains lineage and freshness; SDR or account teams approve actions; RevOps reconciles outcomes. Privacy and platform reviewers define which activation uses are permitted.
Risk: A modeled account signal can be presented as a named-person fact. Small samples may produce unstable economics, popular topics may be ambiguous, and teams may ignore good-fit accounts that have little observable signal coverage.
Cost drivers: Signal licensing, profile or company enrichment, validation, research, data operations, portal or alert delivery, seller enablement, and quality review. Low raw volume does not guarantee low operating cost.
Measurement: Track signal-to-research acceptance, qualified action, opportunity progression, time-to-value, false-positive samples, coverage gaps, and cost per accepted opportunity relative to a fit-only baseline.
Meaningful limitation: Test whether research evidence changes actual prioritization; it does not establish certainty. It may miss buyers researching in unobserved channels and cannot prove budget, authority, or a purchase decision.
3. Tiered blended portfolio
Operating prerequisite: Use a blended model when the business needs both market coverage and timely prioritization. It is particularly useful when sales capacity varies, evidence supply is uneven, and different segments deserve different service levels.
Inputs: One shared account universe, explicit tiers, fit and recency fields, identity states, channel and contact eligibility, capacity by team, transition rules, and distinct action plans. A record should enter a tier for an explainable reason.
Implementation ownership: RevOps owns the tier contract; marketing owns low-touch coverage; sales owns high-touch acceptance; data operations monitors movement and errors. Finance assigns cost and contribution to each tier instead of averaging them together.
Risk: Tier labels can become permanent status symbols. A weak score may hide the components, teams may double-contact the same account, and blended reporting can make the expensive high-touch motion look cheaper than it is.
Cost drivers: All source costs plus tier orchestration, deduplication, routing, differentiated creative, capacity forecasting, and outcome reconciliation. The benefit is that high-cost work is reserved for a bounded cohort.
Measurement: Report movement among tiers, cost per accepted action by tier, seller utilization, nurture progression, qualified outcomes, and incremental lift over random or fit-only prioritization.
Meaningful limitation: A tiered design adds operating complexity. Without clear transition and suppression rules, it becomes several campaigns competing for the same accounts.
4. Trigger-specific plays
Operating prerequisite: Use trigger-specific plays when a particular event – pricing-page activity, a relevant topic surge, a job change, funding, technology change, contract renewal, or repeated product research – supports a distinct, useful action.
Inputs: A defined trigger, source, freshness window, fit requirement, identity confidence, exclusion logic, permitted use, play owner, response-time hypothesis, message premise, and a stop rule.
Implementation ownership: A play owner designs the decision; operations validates the trigger; the seller or campaign owner approves activation; RevOps records response and qualified outcome. Separate each trigger in the measurement plan.
Risk: A colorful trigger can be mistaken for a causal explanation. Events may be delayed, duplicated, or irrelevant to the buyer. Messaging that reveals hidden monitoring can undermine trust.
Cost drivers: Trigger data, monitoring, enrichment, workflow maintenance, creative or sequence variants, rapid research, and low-volume measurement. Multiple triggers can create an expensive rule library.
Measurement: Measure eligible triggers, accepted actions, response by freshness window, qualified outcomes, reversals, and performance versus an eligible non-trigger cohort.
Meaningful limitation: Triggers are sparse and episodic. They cannot replace the foundational work of market coverage, account fit, and sustained demand creation.
5. Experimental allocation with a protected baseline
Operating prerequisite: Use controlled allocation when the team needs to learn how much intent evidence improves prioritization. Preserve a baseline cohort and gradually move budget or capacity only when qualified results justify it.
Inputs: Eligible population, random or defensible assignment, exposure records, comparable service levels, lag assumptions, primary qualified outcome, guardrails, sample plan, and a written decision rule.
Implementation ownership: Analytics or RevOps designs the test; channel and sales owners preserve treatment discipline; finance reviews economic impact; leadership approves scale. Keep the hypothesis fixed during the initial read.
Risk: Small samples, contamination, unequal seller effort, changing creative, and long B2B cycles can create false certainty. Teams may stop tests early after a favorable week.
Cost drivers: Holding back some optimized activity, instrumentation, analyst time, operational discipline, and enough duration to observe meaningful outcomes.
Measurement: Compare accepted work, qualified opportunities, pipeline value with stage controls, cost per qualified outcome, and seller time. Report uncertainty and operational differences alongside averages.
Meaningful limitation: Controlled tests are not always statistically decisive in narrow markets. They still improve judgment by making assumptions, exposure, and stopping rules visible.
Build a bounded tiering workflow
Start with a shared account and contact universe. Normalize accounts, verify current employment where person-level use is permitted, and classify evidence into separate fields: fit, engagement, topic or trigger, identity confidence, contact validity, and downstream relationship. Do not add those fields into an unexplained “hotness” number before the team has tested each component.
Set three or four action tiers. For example: broad nurture or advertising for eligible fit; research queue for fit plus recent evidence; high-touch action for fit plus strong evidence, verified role, and available owner; suppression for customers, competitors, opt-outs, invalid records, or restricted uses. Assign a capacity limit and default action to each.
The operating cadence includes weekly intake and quality review, capacity-based release, destination reconciliation, seller disposition, and monthly economics. Required templates include a market denominator worksheet, capacity calculator, quality-tier definition, signal ledger, suppression register, source-cost table, action SLA, and outcome taxonomy. Tools are useful only if they preserve evidence and rejection reasons across these handoffs.
Choose tools for the actual work
High-volume programs may need universe building, contact and company data, validation, capture, nurture, advertising, and sales engagement. High-intent programs add first-party event analysis, off-site topic or trigger evidence, account and identity resolution, alerts, and richer account research. Both need CRM, consent and preference management, deduplication, suppression, and outcome reporting.
Do not search for a single “best tool” before deciding the operating model. Score each component on coverage for the ICP, source transparency, freshness, confidence states, contact validity, export and activation rights, destination fit, tenant isolation, usage unit, total cost, support, and deletion or suppression controls. A platform that creates more records but hides lineage can reduce the team’s ability to improve.
Test whether the actual capacity model, cost ledger, tier definition and disposition log resolve the operating gap. Count their maintenance and review effort; a template or another feed does not automatically create commercial value.
Budget full costs and contribution
Calculate total cost separately for volume and intent tiers. Include acquisition or data spend, creative and landing pages, enrichment, validation, operations, seller research and follow-up, nurture, CRM administration, quality review, platform fees, rejected-record handling, and a support or compliance reserve. Then allocate shared costs using an explicit basis such as records processed, analyst hours, or active clients.
Define cost per accepted action as the stated full tier cost divided by accepted actions, with the unit and period named. Separate collected revenue, pipeline, contribution before program cost and net contribution after it. Expected outcomes are assumptions until replaced by actual observations. Do not subtract acquisition or delivery cost twice from an already net figure.
Cost per lead can be lower in the volume tier while cost per qualified opportunity is higher. Intent data can raise the first metric while improving the second. Neither pattern is guaranteed. Model normal and adverse cases: lower match rate, higher research time, longer conversion lag, and weaker seller adoption. Payback depends on when contribution arrives, not when a lead is created.
Measure distinct evidence and outcomes
Use a common measurement spine so tiers can be compared. At the input layer, report coverage, validity, freshness, and provenance. At the processing layer, report rejection, duplication, review time, and activation eligibility. At the adoption layer, report seller acceptance, follow-up completion, nurture engagement, and audience delivery. At the outcome layer, report qualified conversation, accepted meeting, opportunity creation, stage progression, win, expansion, and disqualification. At the economic layer, report total cost, capacity used, contribution, and payback.
Keep intent exposure distinct from causation. An account can show intent because it is already in an active sales cycle, and a campaign can receive credit for demand created elsewhere. Use holdouts, staggered release, or matched comparisons when possible. At minimum, retain timestamps and compare the same qualified outcome definition across tiers.
Use an actual internal comparator: how each tier performs against the team’s previous allocation after adjusting for segment, seller capacity, and lag. Public benchmarks can inform a hypothesis but should not become a promise in a proposal.
Check actual operating prerequisites
A volume-heavy design fits broader markets, lower-touch conversion, short sales cycles, strong nurture, and products that benefit from rapid message testing. An intent-heavy design fits finite target markets, higher contract values, expensive research, long buying cycles, and signals that are sufficiently covered and actionable. A blended portfolio adds coverage and review paths; verify its actual volume, complexity, capacity, costs and outcomes instead of assuming it suits most mature teams.
Agencies should qualify the client before selling intent as a cure. The client needs a defined ICP, enough signal supply, a CRM, outcome definitions, a responsible data-use posture, and an owner with follow-up capacity. A narrow client with twenty target accounts may need bespoke account research rather than a scaled platform. A high-traffic self-serve client may need product analytics and lifecycle programs before person-level prospecting.
Review data and action requirements
High-volume programs fail through stale or invalid contact data, duplicate sources, weak consent, indiscriminate sending, and incentives based on meetings rather than opportunity quality. Intent-led programs fail through identity overclaiming, ambiguous topics, thin samples, stale signals, opaque scoring, platform-ineligible uploads, and messages that tell prospects they were monitored.
Verify actual source, recipient, purpose, jurisdiction, necessary fields, advertiser authority, access, retention, correction, deletion, security and suppression. Resolve unanswered requirements before action. Research, enrichment or a contact validation state does not establish every permitted channel or a buyer.
Separate research from agency delivery
MarketPulse supplies topic research and available match details. AIMEE can organize supplied context through configured tools. An agency operating service, branded weekly report, CRM synchronization or custom client interface needs separately verified implementation, rights, scope and fees. The research subscription does not establish those delivery capabilities.
MarketPulse supplies topic research, saved ICP filtering and available match details. A branded report, tier engine, client portal, campaign or separately managed agency service requires its own verified implementation, rights, approvals, support and fees. Do not infer a native white-label sales-and-delivery platform from the research subscription.
AIMEE can prepare a review brief through configured connected tools. Keep proposed actions separate from actual approvals and destination acknowledgements. Confirm the implementation and permissions before execution.
Frequently asked portfolio questions
How should the team choose an allocation?
Begin with market size, capacity, deal economics, and a common qualified-outcome definition. Use broad coverage for learning and future demand, then reserve expensive research and seller work for evidence tiers that pass fit, recency, identity, validation, and eligibility gates.
What data and owners are required?
Use a normalized account universe, contact validation, source and permission records, evidence tiers, CRM routing, suppression, activation, and outcome reconciliation. Demand generation, data operations, RevOps, sales, finance, and risk reviewers need explicit ownership.
Which tools and templates support review?
Use tools for universe and contact data, validation, engagement and topic signals, CRM, nurture, advertising, sales engagement, and analytics. Pair them with a capacity calculator, tier definitions, source ledger, acceptance log, cost waterfall, and outcome taxonomy.
How should coverage and prioritization be compared?
Undifferentiated lists maximize nominal coverage but require strong validation and segmentation. Broad demand generation creates reach and learning. Intent prioritization directs scarce attention. Channel tactics are delivery mechanisms, not substitutes for market, evidence, and capacity design.
What costs belong in each tier?
Budget for data or media, creative, enrichment, validation, operations, seller work, nurture, QA, CRM, and support. Compare cost per accepted action and qualified outcome by tier under normal and adverse usage – not just software price or cost per form fill.
How should actual outcomes be measured?
Use shared stage definitions and timestamps across tiers. Measure quality, acceptance, adoption, qualified outcomes, capacity, and contribution; use controlled comparisons where practical and avoid claiming a signal caused revenue.
Which operating prerequisites should be checked?
Volume fits broad, lower-touch markets with strong nurture. Intent fits finite, high-value markets where research is costly and observable evidence is actionable. Blended portfolios fit teams that need both coverage and efficient human prioritization.
How should evidence types be combined?
Keep each factor distinct, assign an evidence state, and use them as tier gates. Feedback from accepted actions and qualified outcomes should change future allocation through a documented rule, not an opaque score adjustment.
Which mistakes need repair or a stop rule?
Major mistakes include optimizing raw lead count, hiding rejection labor, using stale contacts, treating modeled intent as person-level proof, uploading data without authority, skipping suppressions, and comparing programs with different outcome definitions.
How should an agency scope recurring work?
Offer a portfolio service with market coverage, intent prioritization, validation, activation, reporting, and quarterly allocation decisions. Define tier capacity, included sources, client approvals, usage, SLAs, total-cost assumptions, and the qualified evidence required to scale.
Copyable portfolio comparison
Question: [Actual allocation and comparator.] Scope: [Unique accounts, tiers, period and exclusions.] Evidence: [Source, uncertainty, age and missing fields.] Capacity: [Intake, review, rejection, specialist and action work.] Ownership: [Approver, destination, acknowledgement and recovery.] Outcome: [Actual buyer evidence, feedback and unresolved cases.] Decision rule: [Full costs, quality limits and expansion or stop criteria.]
Record counts do not establish workload capacity
Google’s SRE overload guidance measures resource constraints instead of treating request count as capacity. Its computing context is not a staffing benchmark. As an analogy, test actual intake, review, specialist and action demands separately.
A fictional team has 6,000 usable monthly minutes. Reviewing 1,000 incoming records at three minutes each consumes 3,000. Forty accepted records at 30 minutes of follow-up each add 1,200; 20 exceptions at 30 minutes add 600. Total measured work is 4,800 minutes before omitted support. Dividing all 6,000 minutes by 30 follow-up minutes gives 200, but does not establish capacity for 200 accepted records when intake and exceptions also consume time.
Median time cannot calculate aggregate work
Nine fictional reviews take five minutes and one takes 100. The median is five, but total time is 145 minutes and the mean is 14.5. Multiplying the median by 10 gives only 50 minutes. Report actual sums, the work mix, uncertainty and specialist constraints rather than assuming the typical record represents the whole queue.
Cheap leads can have expensive opportunities
A fictional broad tier costs $2,000 and returns 200 records, 40 accepted actions and four qualified opportunities: $10 per record, $50 per accepted action and $500 per opportunity. A research-prioritized tier costs $3,000 and returns 50 records, 30 accepted actions and six opportunities: $60 per record, $100 per action and $500 per opportunity. The higher input price is not automatically a better or worse business result. Keep costs, outcome definitions, common units and maturity comparable; these invented results are not BrandWell benchmarks.
Overlapping tiers cannot be summed blindly
If two fictional tiers contain 200 and 50 accounts, with 20 appearing in both, the union is 230, not 250. Give each actual account an owner and defined transition or overlapping-membership rule. Repeated research appearances, people and actions remain different units. If both tiers credit the same opportunity, reconcile its ID rather than counting two wins.
Missing feedback and delayed cash matter
Suppose 20 of 30 accepted accounts return feedback and six have qualified opportunities: 30% of reported accounts or 20% of all accepted accounts, with 10 unknown. An opportunity is not collected revenue. A hypothetical $4,000 contribution estimate against $3,000 program cost gives $1,000 modeled net contribution, but if cash arrives after 90 days it does not establish immediate payback. State the assumptions, maturity, actual collection and full cash obligations separately.
Budget the research tier completely
A fictional research pilot uses $500 Growth research, $400 setup, $900 seller work, $700 acquisition and $500 review/support: $3,000. Six opportunities make the defined cost $500 each; another $600 correction raises it to $600 each. With no opportunities the ratio is undefined. These invented service costs are not BrandWell prices or typical performance. General overhead, tax and financing are excluded. A causal commercial conclusion needs a suitable comparator, common units and equal outcome maturity.
Use current research without assuming managed delivery
Review a MarketPulse topic, saved ICP and actual previous-24-hour matches for the approved purpose. Keep uncertain identity, company context, topic research, seller acceptance and buyer response distinct. AIMEE can organize supplied context through configured tools. A named owner verifies exports, messages, audience uploads and CRM writes. Custom tiering, branded reports, client portals, connectors and managed agency services require separately verified implementation, rights and scope.
Review current research: explore MarketPulse and current plans.
Reviewed and updated October 3, 2026.

Written by