On this page
- Define the recovery decision and ledger basis
- Build a nine-step monthly ledger
- Specify inputs, balances and uncertainty
- Verify current research and full operating scope
- Choose evidence for incremental value
- Place each cost in the actual period
- Stress timing, adoption and contribution
- Check whether recovery is supported
- Preserve signal, action and outcome distinctions
- Control bias and missing assumptions
- Separate agency and client economics
- Record recovery and unresolved conditions
- Worked monthly cash-recovery example
- Copyable payback-review record
- Frequently asked payback questions
For a cash-recovery decision, calculate the first period when cumulative incremental net cash benefit covers cumulative program cash outlay. Record collection, fulfillment, setup, ongoing costs, adoption and sales-cycle lag without counting the same cost twice. Keep a separate economic-contribution view; influenced pipeline does not establish cash recovery or incremental value.
Who this is for: buyers, finance, RevOps, analysts and agencies evaluating recovery timing for an intent-research program. Compare the same workflow scope and keep client economics separate from agency fees and delivery costs.
Current MarketPulse offer: intent-data plans start at $500/mo. See the product, demo, and current plans. Updated October 3, 2026.
Define the recovery decision and ledger basis
Payback is useful for sequencing risk. It can answer whether to fund a pilot, whether the expected recovery fits the buyer’s cash constraints, which scope should launch first, and whether renewal or expansion is justified. It does not answer the total value created after recovery, and it can favor short-lived returns over a larger long-term outcome. Use ROI and net present value for those separate questions.
The basic rule is:
Cash payback = the first period when cumulative incremental net cash benefit covers cumulative program cash outlay; preserve a separately labeled economic-contribution model.
The counterfactual is essential. Incremental contribution is the difference between the outcome under the intent-enabled treatment and the credible outcome without that extra treatment, converted to contribution value. It is not the face value of influenced pipeline. The cost side should use cash timing for liquidity decisions and economic cost for operating comparisons; keep both views visible rather than blending them.
Choose the analytical unit before modeling. An account-level program should use eligible accounts and account outcomes. A contact-level motion may need person-level identity and channel eligibility. An agency can model each client and its own reseller portfolio, but client economic payback must not be confused with agency defined service-contribution recovery.
Build a nine-step monthly ledger
A payback-period workflow should be prospective enough to guide a decision and auditable enough to revise:
- Define the scope. Record markets, topics, account universe, identity level, channels, clients, modules, people, and exclusions. Compare providers against the same use case rather than matching a focused service to an entire enterprise suite.
- Set the counterfactual. Use a randomized holdout, phased rollout, matched cohort, stable historical baseline, or explicit planning range. State why the comparison is credible and what it cannot control.
- Map the cash schedule. Place deposits, recurring fees, implementation, integrations, media, labor, agency charges, overages, and renewal payments in the periods they are expected to occur.
- Model adoption. Estimate the percentage of usable signals that teams will review, accept, and activate in each period. Do not assume full utilization on launch.
- Model outcome lag. Connect signal timing to action, opportunity creation, close, fulfillment, and cash collection. Revenue cannot recover an earlier payment before it is economically earned or collected for the decision being modeled.
- Convert outcomes to contribution. Apply finance-approved margin and variable-cost assumptions to incremental won revenue. Keep pipeline as a leading indicator until it becomes an appropriate contribution input.
- Create low, expected, and high cases. Vary signal acceptance, activation, conversion, sales-cycle lag, margin, adoption, implementation effort, and cost – not merely the final return.
- Calculate cumulative balance. For a cash view, subtract program cash outlay from incremental receipts net of defined variable fulfillment cash costs, avoiding duplicate cost lines. Preserve the separate economic-contribution view and label its timing and accounting basis.
- Apply decision and stop rules. Define the acceptable window and the operating evidence required to continue before observing the result.
RevOps should own eligibility, CRM stages, and event lineage. Finance should approve cost timing, contribution, and cash assumptions. Marketing and sales operations should own actual exposure and adoption. Analytics should own the counterfactual and uncertainty. Privacy, legal, and security owners should review use and sharing. Agencies also need client-by-client cost allocation and service-delivery time.
Specify inputs, balances and uncertainty
A useful calculator is a monthly table, not one annualized cell. Build these columns:
| Column group | Inputs | Calculation or output | Sensitivity driver |
|---|---|---|---|
| Scope and eligibility | Eligible accounts, signal family, topic set, identity rule | Eligible and usable signal counts | Coverage, fit, match confidence, freshness |
| Adoption and action | Reviewed, accepted, activated, time to action | Activation rate and action volume | Team capacity, workflow fit, approval delay |
| Commercial outcome | Meetings, qualified opportunities, wins, revenue | Incremental outcome versus counterfactual | Conversion, deal size, sales-cycle lag |
| Contribution | Gross margin, variable fulfillment, collection timing | Incremental contribution by period | Margin and payment timing |
| Program cash | Platform, data, setup, labor, media, agency, governance | Outflow and cumulative outflow | Scope, overage, implementation, staffing |
| Balance | Contribution minus outflow | Period balance and cumulative balance | Every assumption above |
| Confidence | Sample size, missingness, contamination, model range | Evidence label and low/expected/high payback | Data quality and comparison strength |
Swipe the table to see all columns.
If the cumulative balance never reaches zero within the planning horizon, report “no payback in modeled window” rather than extending a straight line until it crosses. If recovery happens only in the high case, the investment has not passed the expected-case test. If one small assumption moves payback dramatically, disclose that sensitivity prominently.
Verify current research and full operating scope
Evaluate current MarketPulse research against the actual workflow, rights, implementation and costs of the program. Research access does not establish a managed agency service, a branded client report or a custom integration.
MarketPulse research is starting at $500/mo. Verify current topics, refreshes, exports and included tools on the product page. Custom interfaces, reporting, integrations and managed delivery require separately verified implementation, rights and fees.
Current MarketPulse research input
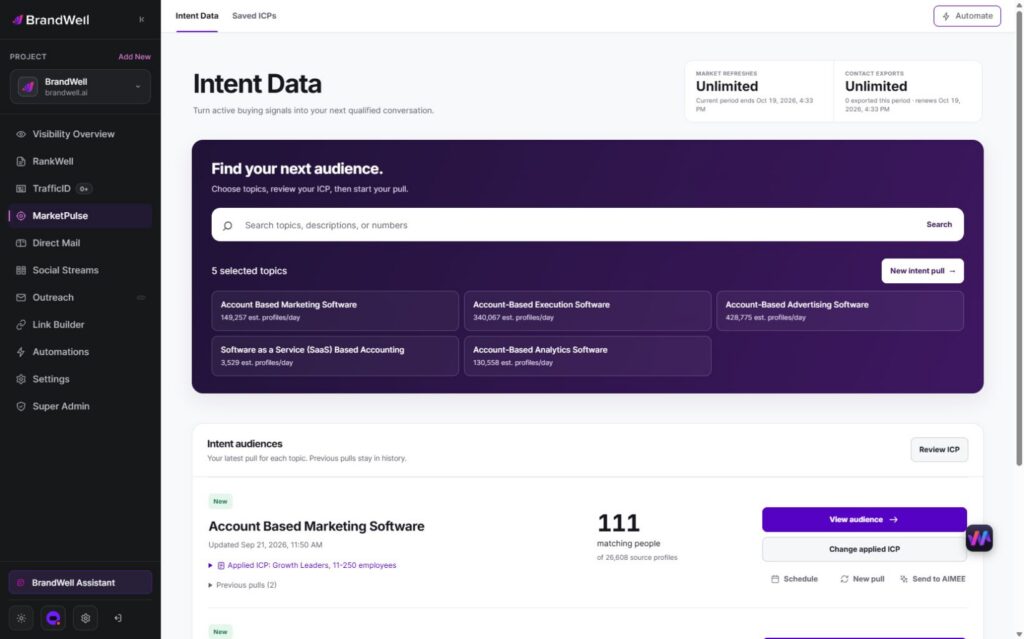
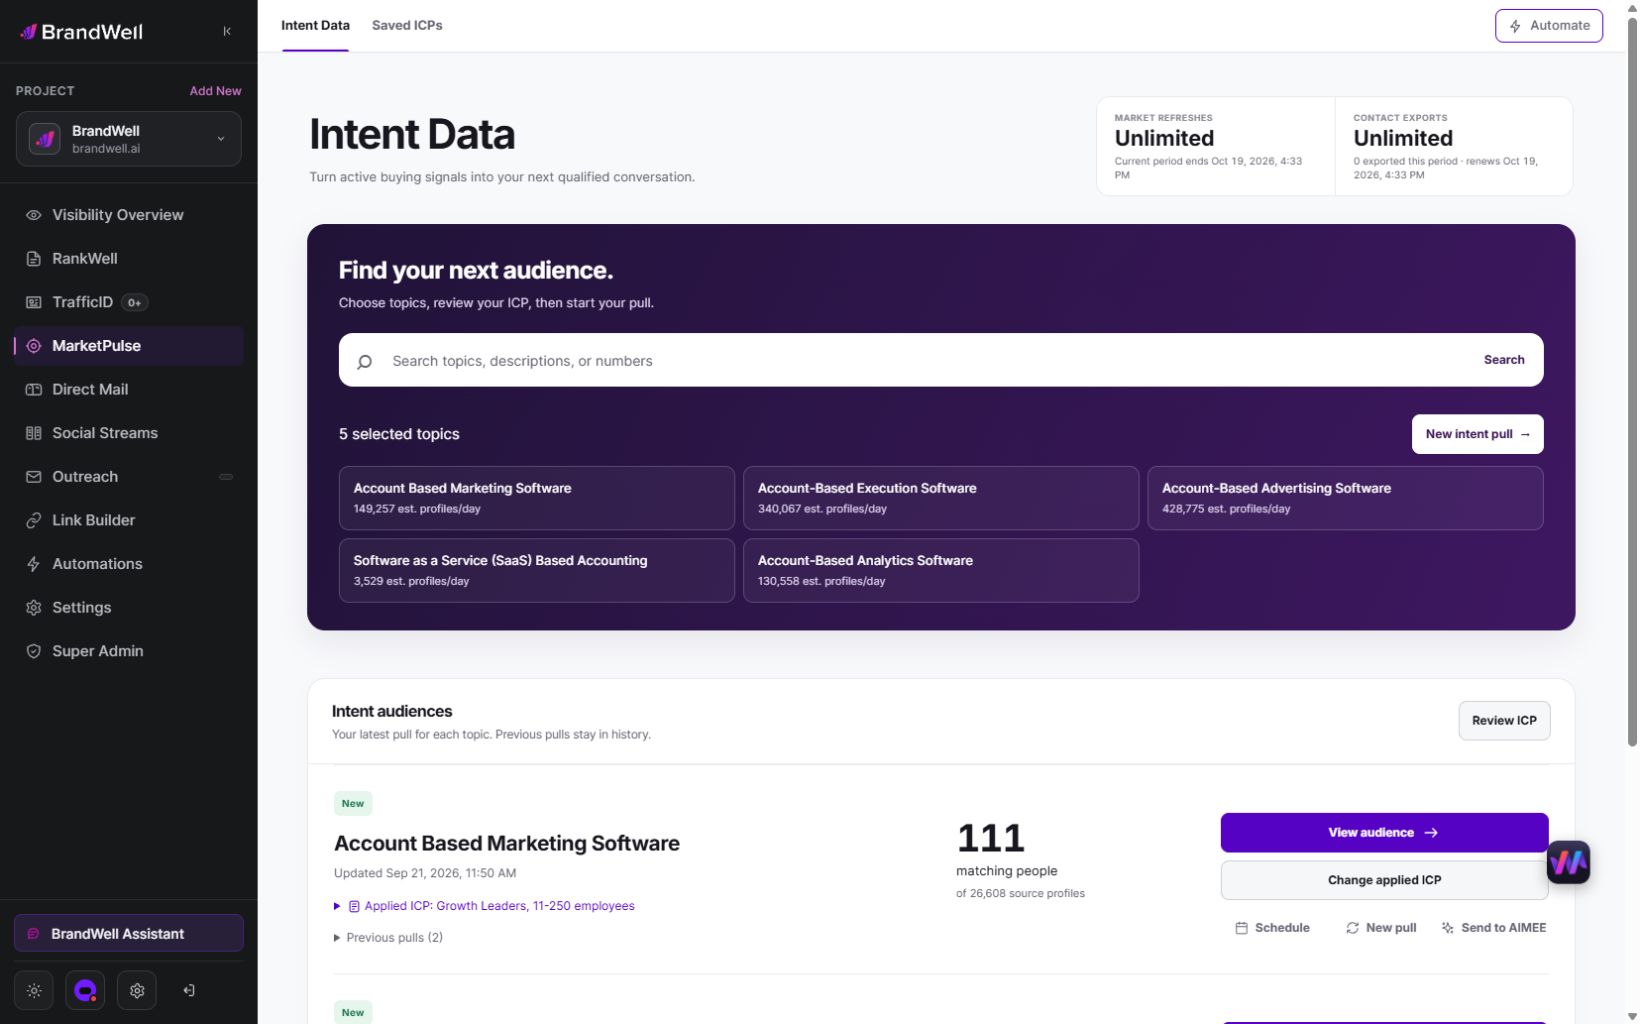
BrandWell MarketPulse: intent data starting at $500/mo. Find people researching topics relevant to what you sell, apply saved ICP filters, and review available contact details before taking action.
| Plan | Topics and refreshes | Monthly exports |
|---|---|---|
| Starter | 1 topic, weekly | 25,000 contacts |
| Growth | 3 topics, daily | 100,000 contacts |
| Scale | 10 topics, daily | Unlimited contacts |
Swipe the table to see all columns.
A pull retrieves available data from the previous 24 hours for one topic. Daily use across all included topics provides 90 Growth pulls or 300 Scale pulls in a 30-day month. Weekly Starter pulls vary by calendar month. Available audience size and contact fields vary, and audiences may overlap. Refreshes stop at the plan limit without overage charges.
- Find and qualify: search the topic catalog, save your ICP, and review the people and companies that match.
- Act on the research: export qualified contacts or prepare an Outreach or Direct Mail workflow. Connected products, channel usage, and fulfillment may cost extra.
- Get help from AIMEE: Growth and Scale include AIMEE for the initial user to research accounts and prepare the next step through connected tools.
Agencies and other service businesses can build client deliverables around their available Intent Scans and exports. Keep each client’s scope, permissions, and service fees clear. A subscription is not a promise of a white-label platform or exclusive access to a market.
Explore MarketPulse and watch the demo or compare plans starting at $500/mo. Any early-access discount is a separate, time-limited offer shown to an eligible recipient.
Choose evidence for incremental value
Descriptive analysis can show signal acceptance, actions, pipeline timing, and costs, but it cannot establish the counterfactual. Rules-based attribution can allocate contribution by a declared touch model; its payback changes with the rule. Matched observational methods can balance known differences while retaining risk from unobserved causes. Phased or threshold designs can support stronger inference when their assumptions are plausible. Randomized assignment usually provides the clearest estimate when the unit, sample, compliance, and outcome window are adequate.
Use the method that the decision and scale support. An agency pilot can establish coverage, workflow adoption, data quality, delivery effort, and early response. It should not claim recovered investment from immature pipeline. When revenue evidence is limited, retain a range and state which milestones must mature before the next payback update.
Place each cost in the actual period
Count actual research, setup, integration, labor, activation, governance, measurement, renewal and exit costs once. Place each cash outlay in its actual period. Show unused credits or entitlements within their paid fee instead of adding the same allocation again. Keep variable fulfillment deducted from benefits separate from the program-cost lines.
Opportunity cost matters when the same people or budget could fund another qualified project. Show it separately if finance does not include it in the cash view. Allocate shared contracts and labor using a documented rule, and test at least one alternative allocation so a favored program does not receive free infrastructure.
Stress timing, adoption and contribution
Key metrics include eligible units, usable-signal rate, time to first usable signal, acceptance, activation, time to action, meeting and qualified-opportunity rates, incremental wins, contribution per win, program outflow, cumulative balance, and the estimated payback point. Agencies should add client acquisition cost, delivery hours, retail receipts, wholesale cost, gross margin, utilization, and retention.
Segment by client, market, account tier, signal source, topic group, freshness, identity confidence, channel, and sales motion when counts support it. Run low, expected, and high cases. Stress adoption, sales-cycle lag, match quality, conversion, contribution margin, implementation delay, overages, and collection timing. Report the assumptions that move the crossing point most.
Check whether recovery is supported
Payback is useful when costs and timing are known, adoption has a realistic ramp, the counterfactual is credible, the outcome window covers the sales motion, and the crossing point remains within an acceptable range under plausible assumptions. It is insufficient when the sample is tiny, the offer or market is unstable, most revenue is immature, treatment and comparison differ materially, controls receive other interventions, or one optimistic conversion rate creates the entire recovery.
If scale is insufficient, use operational gates: coverage, accepted-signal cost, activation capacity, data rights, time to action, early qualified outcomes, and the feasibility of a stronger test. A result of “not enough evidence to project recovery” is better than an arbitrary payback month.
Preserve signal, action and outcome distinctions
Intent data can show which account met a research threshold. Identity data can show the confidence of the account or person connection. Activation records can show which action occurred. Outcome records can show later progression and value. Together they create a traceable mechanism, not a causal conclusion.
Keep delivered, usable, accepted, exposed, and converted stages distinct. A record rejected by sales is part of the cost denominator. A signal that arrives after an opportunity exists should not be credited as its cause. A vendor score should not validate itself; compare it with downstream records and a counterfactual.
Control bias and missing assumptions
Payback looks artificially short when analysts select already-active accounts, exclude failed matches, count all influenced pipeline, ignore control crossover, assume instant adoption, omit sales-cycle lag, use revenue instead of contribution, or leave internal labor out of cost. Freeze assumptions, keep excluded units, log contamination, reconcile outcomes, and display sensitivities.
Map actual source, purpose, identity level, applicable rights, client scope, sharing, access, retention, suppression, correction, deletion and destination. Resolve requirements for the actual implementation before action. An identity match does not establish consent or named-person research behavior.
Separate agency and client economics
An agency payback report should show two ledgers. The client ledger compares the client’s program cash and incremental contribution. The agency ledger compares wholesale cost and delivery capacity with retail receipts and retention. They may show recovery at different times under their actual ledger definitions. Do not use profitable agency economics as proof that the client recovered its investment.
Review an available MarketPulse topic, saved ICP and actual preceding-24-hour matches for the approved research purpose. Keep uncertain company context visible. AIMEE can organize supplied context through configured tools; named owners approve actual exports, messages, audience uploads and CRM writes.
At each client review, update actual cash, adoption, accepted signals, outcome maturity, contamination, and assumption ranges. Recommend one concrete action: expand a faster-recovering segment, continue until specified outcomes mature, reduce an expensive scope, repair an adoption bottleneck, or stop. Retain the prior model so changes in assumptions remain visible.
Record recovery and unresolved conditions
Intent data payback period is a cumulative cash-and-contribution calculation with a counterfactual and realistic lag. It is not annual price divided by influenced pipeline. Model by period, stress adoption and timing, keep the client and agency ledgers separate, and state when recovery does not occur inside the modeled window.
Review current MarketPulse research and separately verify the actual client-service implementation. Use the monthly worksheet below with one market, approved topics, costs, collection assumptions, contribution definition and decision horizon. Do not imply a native branded reseller report or payback calculator.
Worked monthly cash-recovery example
The SEC financial-statement guide distinguishes earned income from cash movement. Keep collection timing visible when the decision concerns cash recovery.
This fictional example has $3,000 setup in month zero and $500 program cash cost monthly. Net incremental cash benefit is receipts less the stated variable fulfillment cash costs, with those costs excluded from the program-cost column to avoid duplication. No incremental benefit is assumed before month three. These invented inputs are not BrandWell prices or actual outcomes; tax, financing, additional overhead and attribution uncertainty remain outside this simplified calculation.
| Month | Net incremental cash benefit | Program cash cost | Period balance | Cumulative balance |
|---|---|---|---|---|
| 0 | $0 | $3,000 | -$3,000 | -$3,000 |
| 1 | $0 | $500 | -$500 | -$3,500 |
| 2 | $0 | $500 | -$500 | -$4,000 |
| 3 | $1,500 | $500 | $1,000 | -$3,000 |
| 4 | $2,500 | $500 | $2,000 | -$1,000 |
| 5 | $2,500 | $500 | $2,000 | $1,000 |
Swipe the table to see all columns.
The first nonnegative observed period is month five. A constant monthly division would miss setup and the initial lag. Do not report an exact day or fractional month without finer cash-timing evidence.
A later reversal can change the recovery interpretation
If month six instead has negative $2,000 net benefit from an included reversal and another $500 program cost, cumulative balance becomes negative $1,500. Month five remains the first crossing in this example, but it does not establish durable recovery. Disclose subsequent cash changes and the actual horizon.
Pipeline and invoices cannot substitute for collection
A fictional opportunity is created in month one, an invoice is issued in month three and payment arrives in month five. For the cash ledger, retain month-five receipt timing. Neither the pipeline amount nor the earlier invoice establishes available cash in month one or three.
Report no recovery within the actual horizon
A fictional low case remains negative $2,000 at the end of a six-month horizon. Report no payback within that modeled window. Do not extend an unsupported growth line to manufacture a crossing point, or relabel a high-case result as the expected case.
Keep client and agency ledgers distinct
A fictional agency receives its service fee promptly and covers defined delivery costs, while the client has not collected any incremental revenue. Agency service profitability does not establish client recovery. Keep actual fees, cash timing, contribution definitions, source costs and allocated work separate.
Copyable payback-review record
Basis: [Cash or economic contribution; included and excluded costs.] Scope: [Actual account unit, cohort, rights and workflow.] Evidence: [Counterfactual, source, sample and uncertainty.] Timing: [Setup, adoption, action, outcome, fulfillment and collection.] Ledger: [Period benefits, costs, cumulative balance and corrections.] Sensitivity: [Low, expected and high assumptions; actual horizon.] Decision: [Recovery, no recovery or insufficient evidence; owner and next review.]
Use supported research within scope
MarketPulse research is starting at $500/mo. Search a relevant topic, save the approved ICP and inspect actual available matches. AIMEE can organize supplied context through configured tools. Owners approve exports, messages, audience uploads and CRM writes. Client reports, custom calculators, integrations and managed delivery require separately verified implementation, rights and fees.
Frequently asked payback questions
Is influenced pipeline collected cash?
No. Preserve actual outcome, attribution and collection evidence.
Can an annual average hide the initial delay?
Use a period ledger with setup, adoption, sales and collection timing.
Does the first crossing guarantee lasting recovery?
No. Disclose later reversals, ongoing costs and the actual horizon.
Does profitable agency delivery prove client payback?
No. Evaluate the client’s incremental value and costs in a separate ledger.
Review current research: explore MarketPulse and current plans.
Reviewed and updated October 3, 2026.

Written by