On this page
- Current MarketPulse research workflow
- Check the actual leadership decision
- Start with a decision and comparator
- Define metrics, sources and ownership
- Use seven dashboard operating assets
- Keep evidence methods distinct
- Count reporting and opportunity costs
- Show relevant metrics and denominators
- Report insufficient decision evidence
- Trace the actual signal-to-action chain
- Check distortion and access risks
- Scope separate client decision reporting
- Copyable executive decision record
- Frequently asked executive-dashboard questions
An intent-data executive dashboard should identify the decision, supporting evidence, uncertainty, costs, action owner and review trigger. Define numerator, denominator, cohort maturity and source before charting. Separate unknown feedback, attributed pipeline and actual business outcomes; a dashboard does not establish causality.
Current MarketPulse offer: intent-data plans start at $500/mo. See the product, demo, and current plans. Updated October 3, 2026.
Current MarketPulse research workflow
BrandWell MarketPulse: intent data starting at $500/mo. Find people researching topics relevant to what you sell, apply saved ICP filters, and review available contact details before taking action.
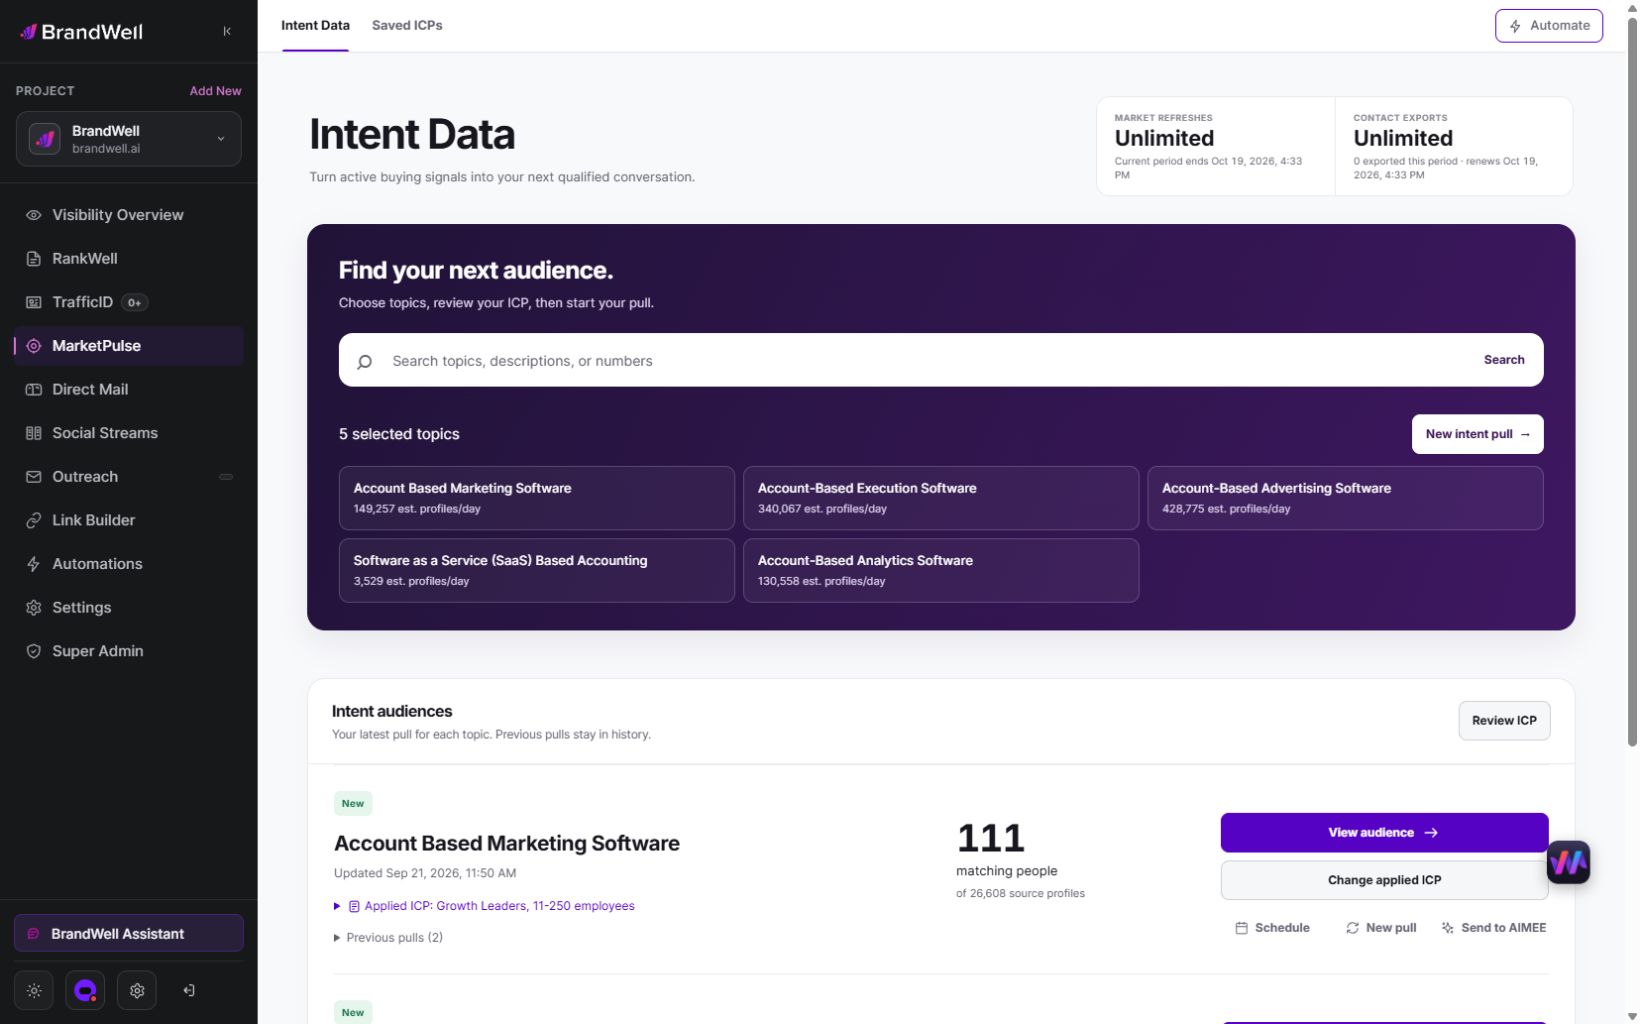
MarketPulse plans are starting at $500/mo. Verify current package scope and offers on the product page.
| Plan | Topics and refreshes | Monthly exports |
|---|---|---|
| Starter | 1 topic, weekly | 25,000 contacts |
| Growth | 3 topics, daily | 100,000 contacts |
| Scale | 10 topics, daily | Unlimited contacts |
Swipe the table to see all columns.
A pull retrieves available data from the previous 24 hours for one topic. Daily use across all included topics provides 90 Growth pulls or 300 Scale pulls in a 30-day month. Weekly Starter pulls vary by calendar month. Available audience size and contact fields vary, and audiences may overlap. Refreshes stop at the plan limit without overage charges.
- Find and qualify: search the topic catalog, save your ICP, and review the people and companies that match.
- Act on the research: export qualified contacts or prepare an Outreach or Direct Mail workflow. Connected products, channel usage, and fulfillment may cost extra.
- Get help from AIMEE: Growth and Scale include AIMEE for the initial user to research accounts and prepare the next step through connected tools.
Agencies and other service businesses can build client deliverables around their available Intent Scans and exports. Keep each client’s scope, permissions, and service fees clear. A subscription is not a promise of a white-label platform or exclusive access to a market.
Explore MarketPulse and watch the demo or compare plans starting at $500/mo. Any early-access discount is a separate, time-limited offer shown to an eligible recipient.
Check the actual leadership decision
This intent data executive dashboard implementation guide is for CEOs, CFOs, CROs, VP Marketing leaders, RevOps, agency owners, and analysts who need a decision-ready view of intent programs. It assumes that the organization can define accepted opportunities and reconcile costs. It is not a generic reporting template, a complete QBR, a broad ROI guide, or proof that a dashboard metric caused an outcome.
Start with a decision and comparator
Start with one recurring executive decision. Examples include whether to expand topic coverage, continue a signal source, change an activation path, invest in identity resolution, or pause a workflow whose quality or privacy risk exceeds tolerance. Every visible metric should change one of those decisions. If removing a tile would not change a discussion or action, move it to an operational view.
Give each decision a baseline or counterfactual. The baseline may be prior performance under the same definitions, a non-intent eligible cohort, a randomized holdout, or a matched comparison with stated limitations. The dashboard should show what would have happened under the current plan as distinctly as what happened after the change.
A strong executive question is: “Given current signal coverage, accepted-pipeline economics, uncertainty, operational capacity, and risk, should we keep, test, scale, redesign, or stop this workflow?” This phrasing prevents an intent data dashboard from becoming an engagement leaderboard.
Define metrics, sources and ownership
Build a metric dictionary before the visual layer. Define eligible account, qualified signal, identity-confidence band, activated record, sales-accepted lead, accepted opportunity, attributed pipeline, observed pipeline, source cost, cohort start, maturity window, freshness, and suppression. Store numerator, denominator, owner, source system, refresh cadence, and known failure modes for every metric.
The minimum data model connects: topic or signal observations; fit and account records; identity-resolution status; activation logs; media, data, and operating costs; CRM acceptance and opportunity events; and governance exceptions. Preserve source lineage and timestamps. A dashboard that cannot trace a number to a governed definition is not executive-ready.
Assign a RevOps metric owner, finance cost owner, marketing activation owner, sales acceptance owner, and privacy/security control owners. At each review cadence: refresh the cohort, reconcile late outcomes, validate data quality, grade evidence, record material changes, present only decision-relevant deltas, assign an action, and capture the next review trigger. Human approval is required before spend, audience, outreach, CRM, or public-reporting changes.
Use seven dashboard operating assets
1. Executive metric tree
Connect the chosen business decision to accepted pipeline, unit economics, activation, signal coverage, data quality, and risk. Display cause-and-effect assumptions as assumptions, not facts. Limitation: a metric tree organizes reasoning but does not establish causal relationships.
2. Decision-first wireframe
Put the decision, recommendation, evidence grade, and owner first; place supporting metrics and drill-down links below. Keep the main view short enough to discuss. Limitation: simplicity can hide operational detail, so preserve traceable supporting views.
3. Evidence-grade badge
Label findings as randomized, quasi-experimental, attributed, observational, directional, or insufficient. Explain the method behind the grade. Limitation: a badge can imply false standardization unless its criteria and reviewer are documented.
4. Caveat and confidence panel
Show sample counts, maturity, missing data, selection concerns, influential accounts, model changes, and open privacy or platform issues next to the recommendation. Limitation: caveats do not excuse a decision whose evidence is fundamentally unusable.
5. Source-cost and outcome bridge
Reconcile data, media, tooling, analyst, agency, and operating costs to activated entities and accepted opportunities. Limitation: shared-cost allocation remains a management assumption and needs sensitivity analysis.
6. Decision and action register
Record keep, test, scale, redesign, or stop; the owner; approval; due condition; rollback rule; and review trigger. Limitation: a register without follow-through becomes a reporting archive rather than an operating system.
7. Agent-ready briefing packet
AIMEE can prepare a review brief through configured connected tools. Keep proposed actions separate from actual approvals and destination acknowledgements. Confirm the implementation and permissions before execution.
Keep evidence methods distinct
Keep these views separate. A randomized experiment can estimate the effect of a specific activation or workflow among eligible units. A quasi-experiment can estimate impact under stronger assumptions. An attribution model assigns credit to touchpoints. An observational comparison describes association. An executive should never need to guess which evidence type produced a number.
Attribution assigns credit under a chosen model. It does not by itself establish incremental pipeline or revenue. Keep attribution, observational comparisons and suitable experiments separately labeled with their actual limitations.
Where a suitable comparison is feasible, define actual assignment, eligible units, primary outcome, observation window, stop rule and contamination checks before interpreting results. Show insufficient evidence rather than forcing a winner.
Count reporting and opportunity costs
Budget the system behind the display: signal and identity data, warehouse or governed store, connectors, CRM normalization, cost reconciliation, dashboard tooling, analyst work, RevOps administration, sales acceptance review, privacy and security controls, agency delivery, and executive review time. Include the opportunity cost of optimizing the wrong metric or delaying a needed decision.
A simple intent data executive dashboard can be built with existing analytics tools when definitions and data are reliable. Evaluate a separately implemented system when markets, clients, workflows, entitlements, and evidence rules differ materially. Tool selection should follow the data contract. “Best intent data dashboard tools” is the wrong starting question if accepted opportunity, source cost, and signal freshness are undefined.
Show relevant metrics and denominators
The main view should contain only metrics tied to the executive decision:
- Market and signal: eligible coverage, qualified signal count, topic concentration, freshness, and source mix.
- Identity and quality: matched account/person bands, confidence, contactability where permitted, duplicate rate, and stale or suppressed records.
- Activation: eligible, routed, reached, excluded, and failed records by workflow.
- Commercial outcome: sales-accepted leads, accepted opportunities, value bands, progression, and maturation.
- Economics: fully loaded source and workflow cost, cost per accepted opportunity, and sensitivity range.
- Governance: restricted-topic blocks, access exceptions, complaints, control failures, and unresolved approvals.
Segment only when the result could change an action: ICP tier, market, signal source, topic family, freshness, identity confidence, activation path, and opportunity value band. Report counts and denominators, not rates alone. Show prior-period restatement and definition changes. Avoid imported intent data executive dashboard benchmarks unless the population, method, and economics are genuinely comparable.
Confidence checks should cover outcome maturity, missingness, mix shift, influential accounts, duplicate identities, attribution window, cost allocation, treatment contamination, and privacy exceptions. Each recommendation needs an evidence grade and a named owner.
Report insufficient decision evidence
The dashboard is useful when leadership faces a recurring decision, the organization has consistent definitions, enough mature outcomes, traceable costs, and owners who can act. It can still be useful at low volume if it explicitly reports readiness, gaps, and risks rather than pretending to rank sources.
Scale is insufficient when one account drives the conclusion, accepted-opportunity practices vary by team, most outcomes remain open, source coverage is unknown, identity confidence is hidden, or the dashboard merges incompatible client populations. The correct output may be “do not reallocate yet.” Use a concise decision memo when the evidence cannot support a scorecard.
Remove vanity metrics that cannot change a decision, such as raw signal volume without market denominator, total dashboard logins, or attributed pipeline without an evidence label. Keep operational diagnostics accessible but off the executive surface.
Trace the actual signal-to-action chain
Display the evidence chain rather than one “hot account” score. Fit shows whether the entity could buy. Intent suggests a possible research theme. Identity resolution estimates the associated company or person. Freshness limits how long that context remains relevant. Activation shows where the record went and whether it was reached. CRM outcomes show what sales accepted. None of these alone proves the next action.
MarketPulse supplies topic research and available match details. TrafficID separately supports own-site visitor review. AIMEE can organize supplied context through configured tools. Custom dashboards, scoring, client interfaces and routing require separately verified implementation, rights, scope and fees.
Use evidence-grade and reason-code fields for every routed group. Expired intent, low-confidence identity, restricted topics, missing fit, or suppression should visibly block or downgrade action. Keep raw behavioral detail away from broad executive access unless it is necessary and authorized.
Check distortion and access risks
Attribution bias, selection bias, survivorship, cohort contamination, late CRM entry, inconsistent sales acceptance, missing costs, stale signals, identity errors, and repeated segment mining can all produce confident-looking but unstable conclusions. Presentation adds another risk: a color or rank can imply certainty the underlying evidence does not support.
Keep actual access, aggregation, necessary fields, retention, correction, deletion, suppression and export owners. Verify implementation and testing. Combining fields or signing a contract does not establish permission for broad access or every downstream use.
Require human approval for any consequential action suggested by the dashboard. Maintain rollback conditions for data pipelines, audience activation, spend, CRM updates, and client-facing claims. Never let an automated narrative convert correlation into causation.
Scope separate client decision reporting
An agency should provide a decision view plus traceable evidence: the client decision, baseline, metric definitions, source-cost bridge, accepted outcomes, evidence grade, caveats, action owner, and next review trigger. Renewal reporting should focus on whether the operating system produced better decisions and reliable delivery – not claim credit for all associated pipeline.
Review an available MarketPulse topic, saved ICP and actual preceding-24-hour matches for the approved research purpose. Keep uncertain company context visible. AIMEE can organize supplied context through configured tools; named owners approve actual exports, messages, audience uploads and CRM writes.
Keep the research subscription distinct from agency decision reporting. Verify actual workspace access, branding, usage, implementation, recipient rights, delivery responsibility and separately agreed fees. A product subscription does not establish client portal or reporting entitlements.
Copyable executive decision record
Decision: [Keep, test, repair, expand or stop.] Metric: [Definition, numerator, denominator and source.] Cohort: [Eligible unit, period, maturity and exclusions.] Evidence: [Method, comparator, missingness and uncertainty.] Economics: [Actual costs, allocation and contribution.] Ownership: [Reviewer, approver and action owner.] Revisit: [Evidence trigger, rollback rule and next review.]
Use a chart that answers the actual question
The UK Government Analysis Function’s chart guidance ties chart choice to the message and recommends equivalent text or tables. It is presentation guidance, not evidence of BrandWell revenue impact. Keep chart units, time windows and source links visible.
Assume fictional source A has 20 accepted opportunities from 100 eligible accounts, while source B has 10 from 1,000. Rates are 20% and 1%. The combined rate is 30/1,100, or 2.7%, rather than the unweighted average of 10.5%. Distinct populations and costs still prevent a simple claim that one source is better. These invented inputs are not BrandWell performance results.
Separate unknown feedback from zero outcomes
If 80 of 100 accepted records have completed feedback and 20 are unresolved, coverage is 80%. Twelve qualified opportunities are 15% of reported records or 12% of all accepted records. The second rate does not establish that the other 20 produced zero opportunities. Preserve their unknown state and restate the same cohort when evidence arrives.
Compare the same outcome maturity
A fictional older cohort with 60 days of observation should not be ranked against a new cohort with seven days as though both have complete outcomes. Compare equal observation ages or show the maturity difference. A change in CRM definitions or late records needs a dated restatement rather than silently changing the historical chart.
Show cost and contribution separately from pipeline
A fictional $2,000 in media plus the standard $500 Growth subscription and $1,000 reporting/review cost gives $3,500 in defined program costs. With ten accepted opportunities, defined cost is $350 each. A $50,000 associated pipeline value is neither cash nor profit. Even $10,000 in realized revenue with $6,000 delivery cost leaves $4,000 before program costs, then $500 after the defined $3,500. Acquisition, general overhead, tax and financing are excluded; these invented inputs are not BrandWell service fees or typical returns.
Use the actual research input
Review an available MarketPulse topic, saved ICP and actual preceding-24-hour matches for the approved research purpose. Keep uncertain company context visible. AIMEE can organize supplied context through configured tools. Owners approve exports, messages, Outreach enrollment, uploads and CRM writes. Custom dashboards, reporting, scoring and client interfaces require separately verified implementation, rights, scope and fees.
Frequently asked executive-dashboard questions
Can source percentages simply be averaged?
No. Preserve counts and weight by the correct denominator.
Does missing feedback mean no opportunity?
No. Keep unresolved outcomes visible.
Is associated pipeline revenue or profit?
No. Report actual realized revenue and defined costs separately.
Does MarketPulse include every custom executive dashboard?
No. Verify actual implementation, rights and scope.
Review the research product: explore MarketPulse and current plans.
Reviewed and updated October 3, 2026.

Written by