On this page
- Define each SaaS funnel metric
- Worked example: one cohort, several rates
- Keep analytics rates consistent with account reporting
- Choose the bottleneck using outcomes and feedback
- Improve one part of the funnel at a time
- Use BrandWell to support the acquisition and follow-up work
- Measure churn separately from new-customer conversion
- SaaS conversion-rate questions
A SaaS conversion rate is the percentage of an eligible audience that completes a defined next step, such as signing up, activating an account or becoming a paying customer. Calculate it as converted users or accounts divided by eligible users or accounts, multiplied by 100. State the audience, event and measurement window with every number.
There is no single “good SaaS conversion rate” that applies to every product. A visitor-to-demo rate and a trial-to-paid rate answer different questions. Use a consistent baseline for your own funnel before borrowing an external benchmark.
Define each SaaS funnel metric
- Visitor to signup: Unique eligible visitors who create an account divided by unique eligible visitors.
- Trial to activation: Trial accounts that complete your defined value-producing action divided by eligible trial accounts.
- Trial to paid: Trial accounts that become paying customers within the stated window divided by trial accounts in the same cohort.
- Activated to paid: Activated accounts that become paying customers divided by eligible activated accounts.
- Demo to paid: Accounts that buy after a completed demo divided by eligible accounts that completed a demo.
A freemium account has no necessary trial expiry. A time-limited trial does. Report them separately if they have different paths to purchase. In team-based software, define whether your unit is a person, workspace or company. Ten users in one paying workspace are not ten new customers.
Worked example: one cohort, several rates
This is an original illustration, not an industry benchmark or a BrandWell result. Suppose 2,000 eligible visitors produce 100 trial accounts. Within 30 days, 60 accounts activate and 20 become paid customers, all of whom activated first.
- Visitor to trial: 100 / 2,000 = 5%.
- Trial to activation: 60 / 100 = 60%.
- Trial to paid: 20 / 100 = 20%.
- Activated to paid: 20 / 60 = 33.3%, rounded.
- Visitor to paid: 20 / 2,000 = 1%.
These rates describe different stages of the same funnel. You cannot compare 33.3% activated-to-paid with another company’s 5% visitor-to-trial rate and conclude that one business performs better.
Wait until the cohort’s conversion window has elapsed. If you count trials that started yesterday alongside trials that started a month ago, newer accounts have had less time to buy. Label incomplete cohorts and avoid treating them as final results.
Keep analytics rates consistent with account reporting
Google Analytics defines separate user-based and session-based key event rates. A session rate counts sessions in which a key event occurred; a user rate counts users who triggered it. Neither automatically equals your billing-system account conversion rate.
Document the event that represents success. A pricing click, checkout start and successful paid subscription should be different events. Reconcile paid customers with billing records and exclude internal tests. Preserve campaign identifiers through the journey so attribution does not disappear between the landing page and checkout.
If a user opens five sessions before buying, the denominators differ. If purchase tracking fires twice, raw event counts can overstate purchases. Investigate discrepancies before optimizing against the report.
Choose the bottleneck using outcomes and feedback
Start where a meaningful number of eligible accounts stop progressing. Review the corresponding experience and ask users what prevented the next step. Avoid assuming every drop-off needs another email.
- Low signup rate: Check whether the page explains the intended user, use case, price and next step. Inspect form errors and mobile load behavior.
- Low activation rate: Check whether a new user can complete a useful task with realistic data. Identify permissions, setup or integration barriers.
- Low paid rate: Check whether pricing and plan limits match the value shown during onboarding. Review objections and reasons for nonpurchase.
- High early churn: Check whether the product delivered the promised outcome and whether customers could continue using it after setup.
Activation should describe a useful result, not merely a login. For a hypothetical reporting app, “created a report using their own data” may be more informative than “visited the dashboard.” Validate that choice against customer behavior rather than assuming it predicts retention.
Improve one part of the funnel at a time
Choose a clear hypothesis, such as “Explaining the required integration before signup will reduce onboarding abandonment.” Define the main metric, the eligible audience and a guardrail, such as refund rate or support burden, before changing the experience.
For an original example, a form change increases signups from 100 to 130 per 2,000 visitors. If paid accounts remain at 20, visitor-to-paid stays at 1%, while trial-to-paid falls from 20% to about 15.4%. More signups did not create more customers in this example.
Where practical, compare randomly assigned groups over the same period. A simple before-and-after comparison can be affected by traffic mix, seasonality, product changes or incomplete cohorts. Report uncertainty rather than labeling every increase a proven improvement.
Use BrandWell to support the acquisition and follow-up work
RankWell supports the briefs, drafts and editorial reviews behind acquisition content. Build pages around the buyer’s actual task, then show the corresponding product workflow with accurate examples.
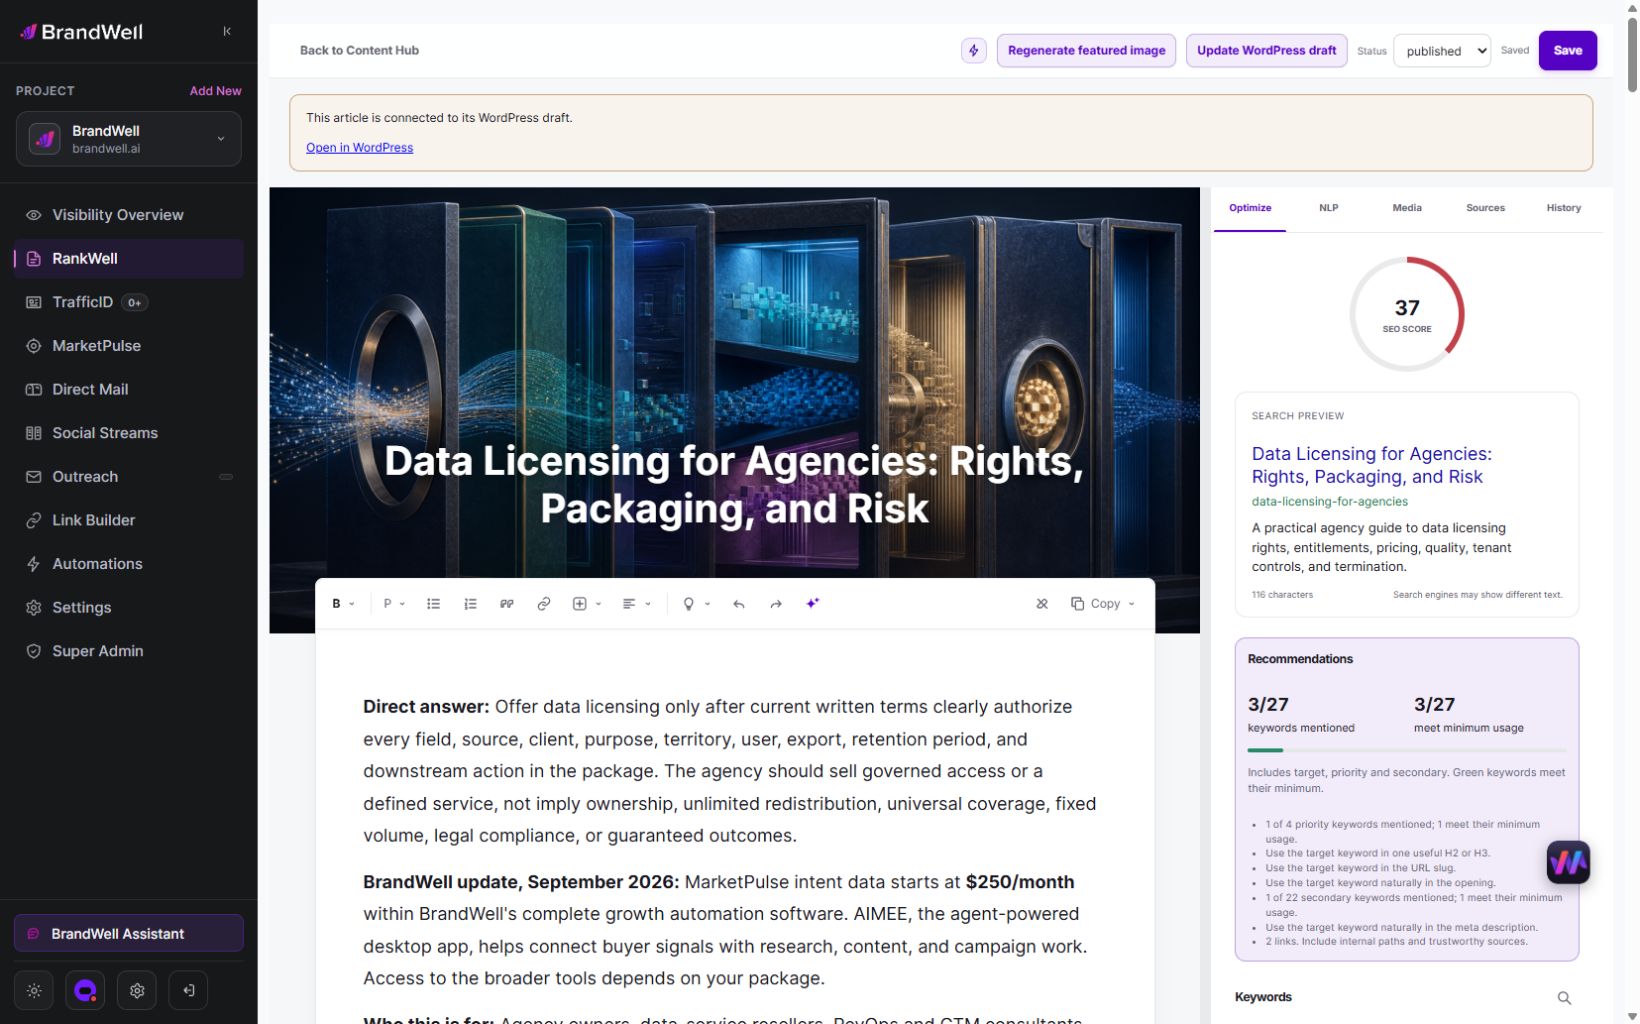
MarketPulse intent data is starting at $500/mo and can support audience research using available topic data and filters. Topic research signals are not a promise that a person will buy. BrandWell Automations and AIMEE can support follow-up work through configured tools and permissions. Define ownership, review and tracking for each workflow.
Measure churn separately from new-customer conversion
A simple customer churn rate is customers lost during the period divided by customers at its start. Define cancellation versus the end of paid service, and distinguish customer churn from revenue churn. Expansion revenue, discounts and different plan prices make those measures diverge.
For an original example, losing five of 100 starting customers is 5% customer churn. It does not tell you the revenue lost unless you know what those customers paid. New customers added during the period should not silently change the starting-customer denominator.
SaaS conversion-rate questions
What is a good trial-to-paid conversion rate?
Evaluate your own mature cohorts by trial type, acquisition source, account segment and price. An external average is useful only when its definitions and sample are comparable. There is no universal threshold in this guide.
Should a trial require a credit card?
Test the full outcome, including trial starts, paid customers, refunds and support needs. Requiring a card changes who enters the trial, so a higher trial-to-paid percentage alone does not prove a better acquisition model.
Is click-through rate a SaaS conversion rate?
CTR measures clicks divided by impressions for a particular placement. It does not measure whether those clicks became activated accounts or paying customers. Connect it to downstream outcomes before judging campaign value.
What should I improve first?
Verify the data, find the largest relevant drop-off and investigate the experience behind it. Start with one test that can improve paid or retained customers, rather than optimizing an isolated percentage.
Reviewed and updated October 2, 2026.

Written by
Julia McCoy has contributed articles to BrandWell on content marketing, writing, and search engine optimization. This archive retains her original bylines; individual articles may be updated by the BrandWell editorial team.