On this page
- Who this is for
- How should an agency benchmark performance to improve adoption, renewal, and expansion?
- What cadence, ownership, playbooks, and communication are required?
- Which tools and templates best support performance benchmarking?
- How do proactive, reactive, and data-led approaches compare?
- What should an agency invest, and how should expansion economics be measured?
- Which adoption, health, renewal, expansion, and revenue metrics should be used?
- Which clients, contract stages, and risk profiles need different approaches?
- Which signal, identity, activation, and outcome evidence matters most?
- What attribution, expectation, data-use, and trust risks affect benchmarking?
- How should benchmarking be built into a recurring service and QBR?
- Use a worked example with separate denominators
- Inspect a current MarketPulse sample
- Frequently asked questions
Direct answer: Benchmark an intent-data service against its own controlled baseline first, then against comparable client segments and operating periods. Measure signal quality, activation, adoption, outcomes, delivery effort, margin, and trust as separate layers. Never use an unverified industry average as proof that a client program is good or bad.
Current MarketPulse offer: intent-data plans start at $500/mo. See the product, demo, and current plans. Updated October 3, 2026.
Benchmarking intent-data service performance is not the act of putting a number beside a chart. It is a disciplined comparison that helps an agency decide what to keep, change, expand, or stop. A useful benchmark records the cohort, denominator, signal definition, time window, exclusions, data source, and owner. Without those details, apparent improvement can be caused by market size, seasonality, a new sales team, or a changed definition.
Who this is for
This guide is for agency analysts, operations leads, account directors, and owners who need to prove service quality without overstating attribution. It applies to recurring intent reporting, website visitor identification, audience activation, prospecting support, and client QBRs.
How should an agency benchmark performance to improve adoption, renewal, and expansion?
Begin with the decision the client expects to make. Examples include which accounts to research, which visitors deserve follow-up, which topics merit a campaign, or which audience should receive budget. Build the benchmark around that decision, not around whatever metric is easiest to export.
Use a four-layer ladder. Layer one is input integrity: eligible market, signal availability, identity state, freshness, and exclusions. Layer two is operational performance: acceptance, processing time, exception rate, and activation completion. Layer three is client adoption: views, reviews, dispositions, actions, and feedback returned. Layer four is commercial evidence: qualified conversations, opportunities, influenced pipeline, delivery cost, gross margin, renewal, and expansion. Keep association distinct from influence and incrementality.
First compare with a clearly defined internal baseline, using comparable eligibility, periods, channel, capacity and signal meaning. Pre-service periods and matched cohorts describe association; selection, seasonality and seller differences can confound them. Where feasible, use a properly designed randomized holdout to estimate incrementality with uncertainty. A review can inform adoption and renewal decisions but cannot guarantee either.
What cadence, ownership, playbooks, and communication are required?
Assign one metric owner, one data steward, one client decision owner, and one service owner. The metric owner maintains definitions. The steward reconciles sources and exceptions. The client owner returns dispositions. The service owner turns evidence into a recommended action.
Operate on three cadences. A weekly operations review catches missing feeds, delayed imports, identity shifts, suppression failures, and unworked signals. A monthly performance review compares the current cohort with its baseline and explains definition changes. A quarterly decision review examines adoption, economics, renewal risk, and the next controlled test. This weekly and monthly intent-data reporting framework shows how to separate delivery health from business interpretation.
Create a metric dictionary and change log. Every KPI needs a plain-language definition, formula, numerator, denominator, source fields, filters, owner, freshness limit, and response threshold. Send a short pre-read that states what changed, what did not, what remains unknown, and which decision is requested. After the meeting, record the decision, owner, due date, and measurement plan. This cadence turns benchmarking into service management rather than presentation theater.
Which tools and templates best support performance benchmarking?
The best benchmarking intent-data service performance tools are the smallest governed stack that can preserve definitions and trace outcomes. Agencies typically need the following seven components:
- Source register: identifies every signal, enrichment, CRM, media, and outcome source.
- Metric dictionary: stores formulas, denominators, exclusions, owners, and change history.
- Cohort table: freezes account eligibility, segment, start point, and comparison group.
- Evidence ledger: connects a signal to qualification, action, disposition, and downstream event without claiming more causality than the evidence supports.
- QA queue: holds duplicates, unresolved identities, stale fields, rejected activations, and client corrections.
- Service-cost model: combines vendor usage, analyst time, support, corrections, and allocated overhead.
- Decision brief: summarizes the comparison, limitation, recommended test, owner, and review point.
A spreadsheet can support an early program if access, definitions, and changes are controlled. A warehouse and business-intelligence layer may suit higher volume. Customer-success software helps manage health and renewal, but it does not repair weak signal definitions. The useful template is the one that preserves lineage from input to decision.
A copyable benchmark specification
Before calculating a result, complete one specification row for every measure. Name the business question, accountable owner, population, eligibility rule, numerator, denominator, event time, observation window, source system, join key, exclusions, identity state, known limitations, response threshold, and next review. Add a version identifier whenever any element changes. This makes a benchmark reproducible and lets a new analyst explain why two periods differ.
For example, do not record only “accounts activated.” Define whether the population includes all client accounts or only eligible accounts, whether activation means accepted by the destination or merely uploaded, which duplicate and suppression rules apply, and how late events are handled. Record both the count and the rate. Counts show operational scale; rates make appropriately matched cohorts easier to compare.
A stoplight without false precision
Use green, watch, and intervene as operational states, not judgments about vendor quality. Green means the measure stayed inside its documented operating range and no material exception is unresolved. Watch means evidence is incomplete or the measure crossed an early-warning threshold. Intervene means the agreed owner must investigate before the next release or client action. Avoid a single weighted score unless every weight and tradeoff is understood. A composite can hide a serious identity or suppression failure behind strong volume.
Every state needs a response. Green may continue the workflow and sample normally. Watch may increase the QA sample, reconcile sources, or ask the client for missing dispositions. Intervene may pause activation, correct records, notify the appropriate owner, or narrow scope. The benchmark becomes valuable when it changes behavior consistently.
How do proactive, reactive, and data-led approaches compare?
A reactive approach reviews performance when a client complains or a renewal is close. It requires little routine effort, but defects can age silently and the agency may lack a credible baseline. A proactive approach schedules health checks and flags thresholds before the client asks. It improves continuity, although teams can waste effort monitoring metrics that do not change decisions.
A data-led approach combines review with a pre-specified question and comparison. For example, ask whether high-fit topic signals reviewed within a stated window are associated with more accepted conversations. Freeze the cohort, definition, observation period and exclusions. A matched comparison is observational; use an appropriate randomized design if making causal claims.
A proposed operating model combines scheduled monitoring with bounded tests and reactive escalation for incidents. Choose the effort from the client decision and available evidence. A chart is not an experiment merely because it has many measures.
What should an agency invest, and how should expansion economics be measured?
Budget for instrumentation, analysis, client review, and maintenance. Capture setup hours for definitions, mappings, baselines, and dashboards. Capture recurring hours for QA, reconciliation, interpretation, reporting, meetings, and corrections. Add data-platform fees, usage charges, storage, CRM work, and support. Set aside capacity for definition changes and disputed attribution.
Measure expansion economics with incremental recurring revenue minus the incremental direct cost of the expanded scope. Include additional topics, signal volume, client workspaces, analyst time, integrations, support, and risk. Compare contribution margin, payback period, capacity use, and expected retention under conservative assumptions. Do not treat influenced pipeline as collected revenue or assign every opportunity to intent data.
Use three scenarios: current service, controlled expansion, and no expansion. Require a client owner, a new decision, sufficient data, and a review point before adding scope. Expansion is attractive only when it creates useful adoption and acceptable margin. More reports without more decisions can lower service quality even when revenue rises.
Which adoption, health, renewal, expansion, and revenue metrics should be used?
Use a balanced benchmark card rather than one composite score. Recommended measures include:
- Signal quality: eligible coverage, recency, recurrence, source diversity, match state, validation status, duplicate rate, and correction rate.
- Activation: accepted records, rejected records, time to human review, time to channel, delivery completion, and suppression success.
- Adoption: named users active, reports reviewed, accounts dispositioned, actions completed, and feedback returned.
- Outcome evidence: qualified conversations, opportunities, stage movement, losses, pipeline association, influence notes, and controlled lift where available.
- Service health: incidents, exceptions, response time, rework, delivery hours, and client questions.
- Economics: recurring revenue, direct data cost, delivery labor, gross margin, credits, renewal, and expansion.
Document the denominator. A response rate based on delivered emails is different from one based on accepted leads. A coverage rate based on the full market is different from one based on eligible accounts. For deeper causality discipline, use an intent-data pipeline attribution framework that distinguishes association, influence, and incrementality.
Which clients, contract stages, and risk profiles need different approaches?
Segment benchmarks before drawing conclusions. A new client needs an instrumentation and baseline phase. An adopted client needs stability and outcome review. A renewal-risk client needs root-cause analysis and a narrow recovery plan. An expansion candidate needs proof that the current workflow is used and that a new use case has an owner.
High-volume, low-value markets may emphasize automation accuracy, suppression, and unit economics. Low-volume enterprise markets may emphasize account relevance, research quality, stakeholder engagement, and long sales cycles. Website visitor programs require explicit identity-state measures. Paid audience programs need platform acceptance, spend, and matched-account engagement. Prospecting programs need validation, deliverability controls, dispositions, and manual review.
Also segment by client maturity. Do not compare a client with clean CRM stages and disciplined dispositions against one with no feedback loop. Present the difference as a data-quality constraint, not a character judgment. The agency should state what comparison is valid, what is directional, and what cannot yet be measured.
Which signal, identity, activation, and outcome evidence matters most?
For each benchmark row, preserve the signal source category, topic or behavior, recency, recurrence, fit result, and exclusions. Preserve identity as a state, not a binary truth: company-level match, known person, candidate person, unresolved, suppressed, or corrected. Record validation status and the time each field was checked.
Activation evidence should show the approved destination, field mapping, human reviewer, send or upload state, rejection reason, and completion time. Outcome evidence should return from the client system through stable identifiers. If the connection is probabilistic, label it. If a salesperson creates an opportunity after independent activity, do not automatically credit the intent signal.
The agency should maintain a QA sample that includes both accepted and rejected records. Reviewing only successful examples produces a distorted benchmark. Use the lead and intent-data quality assurance checklist to create release gates for freshness, identity, duplication, suppression, and exceptions.
What attribution, expectation, data-use, and trust risks affect benchmarking?
The largest attribution risk is turning correlation into causation. Other risks include changing definitions without annotation, selecting only successful cohorts, ignoring seasonality, excluding losses, combining unlike identity states, using tiny samples as certainty, and presenting vendor-reported metrics as independently verified.
Expectation risk arises when a benchmark becomes a guarantee. Set a target as a planning threshold with assumptions, not a promise of pipeline, revenue, sales, or profit. Data-use risk includes excessive collection, unauthorized activation, weak access control, stale retention, and exposing inferred research behavior in outreach. Client-trust risk increases when the agency cannot reproduce a number or explain a correction.
Keep raw evidence separate from interpretation. Document purpose and retention, restrict access, honor suppressions and ask a qualified reviewer about the actual obligations. A benchmark does not establish compliance, certification or permitted data use.
How should benchmarking be built into a recurring service and QBR?
Package benchmarking as a maintained operating layer: weekly delivery health, monthly cohort comparison, quarterly decision review, a metric dictionary, a change log, an exception queue, an evidence ledger, and a client action register. The QBR should show baseline, current state, variance, explanation, limitations, economics, and one proposed test. End with continue, correct, expand, narrow, or stop.
Store a compact audit packet after each review: the frozen cohort, exported source files or stable references, calculation version, exception decisions, client corrections, meeting decision, and assigned actions. At the next review, start with the prior decision and show whether the promised action occurred. This prevents a recurring report from resetting the story every period. It also gives the agency concrete renewal evidence: not just activity, but a sequence of documented decisions and improvements.
When a client does not return outcomes, label that as a measurement gap and propose the lightest workable feedback method. Do not silently substitute opens, clicks, or report views for revenue evidence. If the client cannot support the measurement burden, narrow the claims and price the service around the deliverable the agency can actually verify.
Agent-ready benchmark instruction:
Using only the approved metric dictionary and supplied records, compare the named cohort with its frozen baseline. Show numerator, denominator, filters, missing data, identity states, definition changes, and confidence limits. Separate association, influence, and controlled evidence. Flag anomalies for a human. Do not invent benchmarks, causal claims, prices, identities, legal conclusions, or outcomes. Do not send reports, change CRM data, activate audiences, or contact anyone without human approval.
AIMEE can help prepare configured work through connected tools using approved inputs. Inspect calculations and missing evidence. A person should approve definitions, exclusions, client-facing interpretation and external actions; an instruction does not establish a working integration.
Use a worked example with separate denominators
In a fictional batch, 120 raw records reduce to 100 unique eligible records after documented exclusions. Eighty pass the agreed review gates; 60 of those reach a confirmed destination. Review-pass rate is 80 ÷ 100 = 80%. Destination completion among passed records is 60 ÷ 80 = 75%; end-to-end completion among eligible records is 60 ÷ 100 = 60%.
These measure different steps. They are not buyer-intent accuracy or vendor-wide benchmarks. A pass means the documented gates were met, not that a person will buy. Record excluded and unresolved cases as well as the successful ones.
Google’s SRE workbook recommends good-event/total-event ratios for service indicators. Define what qualifies as good and which events enter the denominator. This operational method does not establish intent validity or commercial causality.
If the full relevant review and delivery cost is $900, cost per eligible record is $9; cost per confirmed destination completion is $15. State which costs are included, distinguish overhead and acquisition costs, and compare periods only after reconciling definition changes. These are arithmetic examples, not expected BrandWell results.
Inspect a current MarketPulse sample
MarketPulse supports topic research, ICP filtering and available contact records. Standard Starter includes one weekly-refresh topic. Growth includes three daily topics; Scale includes ten daily topics. Audience size, available fields and overlap vary.
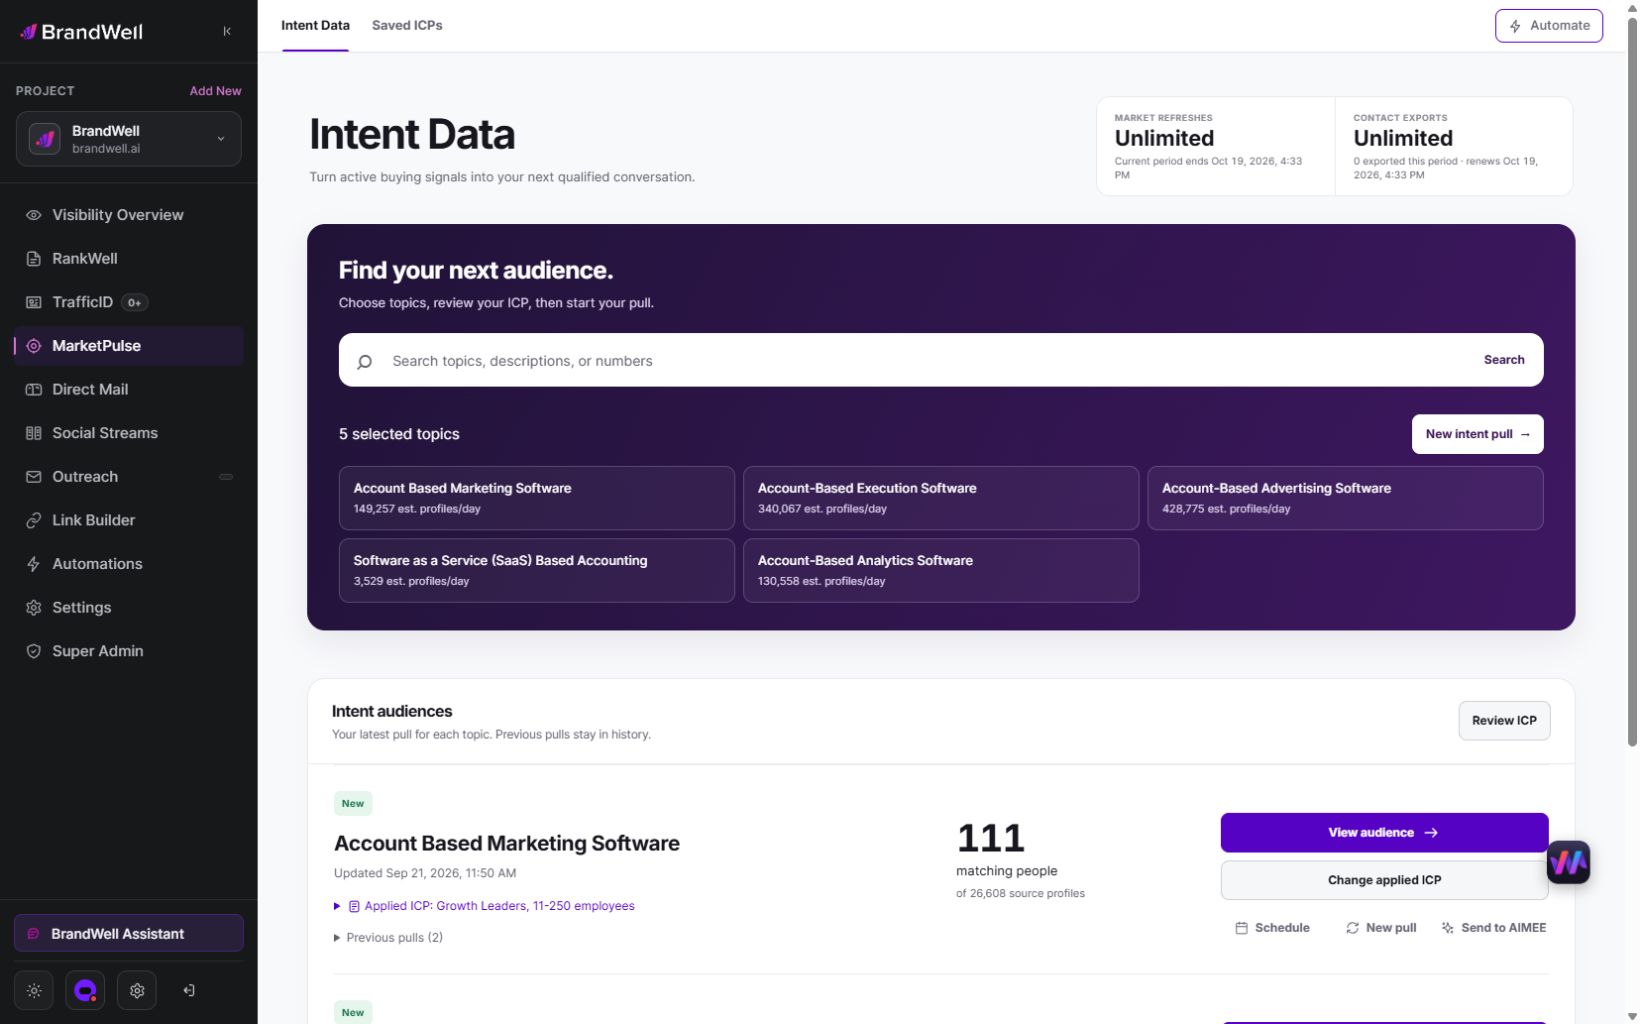
Review a relevant topic and ICP, document exclusions and assess the work required to prepare an approved next action. Connected products and channel use can cost extra. Watch the demo and compare the current plans.
Frequently asked questions
What is a good intent-data benchmark?
One with a defined population, numerator, denominator, period and meaning. Compare relevant internal cohorts before using an external number whose definitions or source you cannot reproduce.
Does a matched cohort prove ROI?
No. It can describe association, but selection and other differences can explain outcomes. Use an appropriate causal design before claiming incrementality and include the relevant costs.
Is accepted data the same as validated buying intent?
No. Operational acceptance shows specified gates were met. It does not independently verify who researched a topic, permission to contact them or whether they intend to purchase.
What if the client cannot report sales outcomes?
Report the delivery and adoption evidence you can verify, label the measurement gap and narrow the claim. Do not substitute opens or dashboard views for revenue.
Reviewed and updated October 3, 2026.
MarketPulse plans are starting at $500/mo. Review current package scope, usage and any separate product or service costs before purchase.

Written by