


On this page
Social media usage statistics do not tell us how many people have an addiction. A survey about hours online, a person’s feeling that they use an app too much, and a study of mental-health symptoms measure different things. Keep those distinctions when writing about social media addiction statistics.
This review replaces the earlier article’s unsupported global addiction totals, platform rankings and causal health claims with a smaller set of dated findings. The figures below describe the populations and periods studied; they are not a new worldwide prevalence estimate for 2026.
What the primary sources actually measured
Gallup: reported time spent by U.S. teenagers
Gallup’s 2023 survey reported an average of 4.8 hours per day across seven social media platforms. It found that 51% of U.S. teenagers reported at least four hours daily. The survey included 1,591 adolescents and ran June 26 through July 17, 2023. These are self-reported usage findings, not diagnoses. Read Gallup’s report and survey details.
JAMA Psychiatry: an association in a youth cohort
A 2019 study analyzed 6,595 U.S. adolescents using data collected from 2013 to 2016. Greater reported social media time was associated with certain reported mental-health problems. The researchers noted limitations including self-reported exposure and symptoms, rather than diagnostic interviews. The observational findings do not establish a universal addiction rate or prove that social media caused an individual person’s symptoms. Read the study and its limitations.
HHS: benefits, risks and remaining evidence gaps
The U.S. Surgeon General’s 2023 advisory describes both benefits and potential harms for children and adolescents. It says the available evidence does not establish that social media is sufficiently safe for youth and calls for further research and protective action. It is a public-health advisory, not a measurement of worldwide social media addiction. Read the HHS advisory and resources.
Why a global addiction total needs stronger evidence
A global platform-user count cannot be multiplied by a percentage from an unrelated survey to create a reliable global addiction estimate. The populations, age ranges, measurement instruments and definitions would need to be comparable. A survey asking whether people feel addicted should not be relabeled as a count of clinically diagnosed people.
The previous version mixed incompatible totals and described usage duration as though it identified the most addictive platform. Those comparisons have been removed. A service with longer average sessions is not automatically the service with the highest rate of problematic use.

A checklist for using a statistic in marketing content
- Source: link to the original research or survey report.
- Date: show when the observations were collected, not just the article’s update year.
- Population: name the country, age group and sample.
- Measure: distinguish usage, self-perception, screening results and diagnoses.
- Claim: preserve the difference between association and causation.
- Image: make chart labels and captions match the source’s actual finding.
For example, a hypothetical survey of 200 customers finds that 80 say they check a brand’s updates weekly. The supported statement is that 40% of those respondents reported weekly checking. It would not establish a population-wide rate, a health condition or a reason that they checked. This is an arithmetic example, not a research finding.
Use BrandWell to support editorial and social workflows
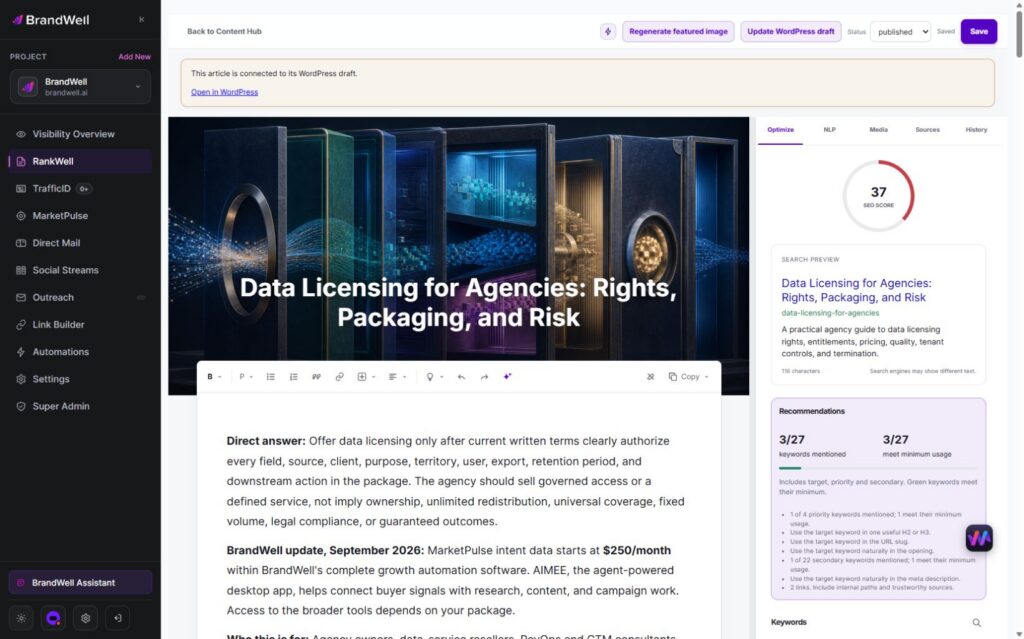
For a research-based article, use RankWell to develop the brief and draft, then inspect the sources and wording in the editor. Add verified evidence, limitations and your own relevant examples before approval. An AI-generated citation or confident sentence still needs checking.
SocialStreams supports configured social workflows in BrandWell. Give each post an audience, a useful point and an approval owner. Check the connected destination and action permissions before publishing. BrandWell’s marketing tools are not a treatment for compulsive use or a substitute for professional health advice.
Questions about interpreting these statistics
Does daily social media use establish addiction?
No. A usage-frequency statistic describes behavior reported in that study. It does not by itself identify a health condition. Keep the report’s original measure visible when quoting it.
Can we compare studies from different years?
Only with attention to changes in population, survey questions, services included and methods. A different average does not prove a trend when the underlying measurements differ.
Can a marketing tool resolve a health problem?
That is not a supported use of BrandWell. If social media use is causing distress, the HHS resources offer a starting point for finding appropriate support. For content production and publishing, explore RankWell or review SocialStreams.
Reviewed and updated October 3, 2026.

Written by
 Farnaz Kia